HOT TOPICS LIST
- MACD
- Fibonacci
- RSI
- Gann
- ADXR
- Stochastics
- Volume
- Triangles
- Futures
- Cycles
- Volatility
- ZIGZAG
- MESA
- Retracement
- Aroon
INDICATORS LIST
LIST OF TOPICS
PRINT THIS ARTICLE
by Koos van der Merwe
GM losses reach US$15.5 billion – is this the end of the American automaker?
Position: Sell
Koos van der Merwe
Has been a technical analyst since 1969, and has worked as a futures and options trader with First Financial Futures in Johannesburg, South Africa.
PRINT THIS ARTICLE
WILDER'S RSI
Is This The End Of An Era For GM?
08/04/08 03:29:27 PMby Koos van der Merwe
GM losses reach US$15.5 billion – is this the end of the American automaker?
Position: Sell
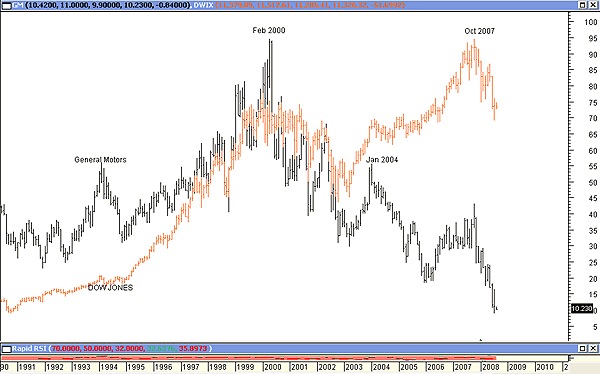
| Do GM's massive losses mean the end of the automaker? Money-losing lease agreements, sputtering auto sales, and a costly effort to turn its business around have caused the third worst loss in GM's 100-year history. Thousands of workers have been laid off, with factories closed as the company sheds assets to cope with a steep downturn in customer demand. In the past, GM's chart was parallel with that of the Dow Jones Industrial Average (DJIA). Is the present chart of GM telling us something? |

|
| FIGURE 1: GM, DJIA, MONTHLY |
| Graphic provided by: MetaStock. |
| |
| Figure 1 is a monthly chart of General Motors superimposed on a monthly chart of the DJIA. Note how the two moved in tandem until January 2004, when as the DJIA continued to rise, GM fell away. GM is still one of the companies that make up the DJIA, and its fall must have weighed on the DJIA's performance. What is interesting to note on the chart is that in spite of GM's fall, when GM corrected, the DJIA corrected and its high in October 2007 was also a high in GM's price as it continued to fall. |

|
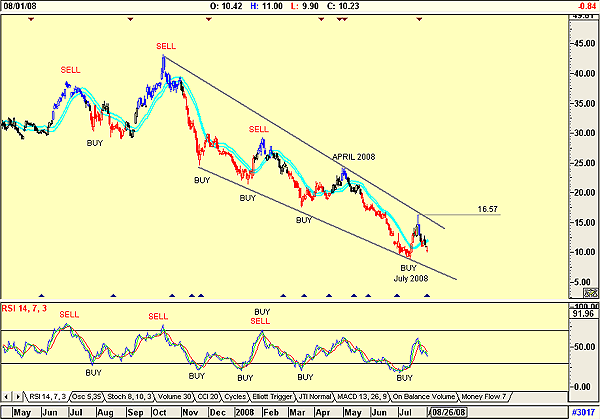
| FIGURE 2: GM, DAILY |
| Graphic provided by: AdvancedGET. |
| |
| Figure 2, a daily chart of General Motors, is interesting because it shows the inexorable fall in the price. Even though the relative strength index (RSI) gave buy signals, GM reacted to them but never followed through, especially from April 2008. One can ask whether the recent buy signal of July 2008 is effective or a failure. |
| Has GM bottomed? Obviously, the answer depends on the trend of the DJIA. If the DJIA has bottomed and will now start moving up, a sign that the US economy is recovering, then GM will start recovering. Otherwise, as the chart suggests, as the DJIA falls, so will GM, but far, far faster. |
Has been a technical analyst since 1969, and has worked as a futures and options trader with First Financial Futures in Johannesburg, South Africa.
| Address: | 3256 West 24th Ave |
| Vancouver, BC | |
| Phone # for sales: | 6042634214 |
| E-mail address: | petroosp@gmail.com |
Click here for more information about our publications!
PRINT THIS ARTICLE

Request Information From Our Sponsors
- VectorVest, Inc.
- Executive Premier Workshop
- One-Day Options Course
- OptionsPro
- Retirement Income Workshop
- Sure-Fire Trading Systems (VectorVest, Inc.)
- Trading as a Business Workshop
- VectorVest 7 EOD
- VectorVest 7 RealTime/IntraDay
- VectorVest AutoTester
- VectorVest Educational Services
- VectorVest OnLine
- VectorVest Options Analyzer
- VectorVest ProGraphics v6.0
- VectorVest ProTrader 7
- VectorVest RealTime Derby Tool
- VectorVest Simulator
- VectorVest Variator
- VectorVest Watchdog
- StockCharts.com, Inc.
- Candle Patterns
- Candlestick Charting Explained
- Intermarket Technical Analysis
- John Murphy on Chart Analysis
- John Murphy's Chart Pattern Recognition
- John Murphy's Market Message
- MurphyExplainsMarketAnalysis-Intermarket Analysis
- MurphyExplainsMarketAnalysis-Visual Analysis
- StockCharts.com
- Technical Analysis of the Financial Markets
- The Visual Investor
