HOT TOPICS LIST
- MACD
- Fibonacci
- RSI
- Gann
- ADXR
- Stochastics
- Volume
- Triangles
- Futures
- Cycles
- Volatility
- ZIGZAG
- MESA
- Retracement
- Aroon
INDICATORS LIST
LIST OF TOPICS
PRINT THIS ARTICLE
by Alan R. Northam
Silver Standard Resources made a market top in late 2007 and has been trading lower this year. Over the last few months, SSRI has been in a narrow trading range that looks ready to break down and move lower.
Position: N/A
Alan R. Northam
Alan Northam lives in the Dallas, Texas area and as an electronic engineer gave him an analytical mind from which he has developed a thorough knowledge of stock market technical analysis. His abilities to analyze the future direction of the stock market has allowed him to successfully trade of his own portfolio over the last 30 years. Mr. Northam is now retired and trading the stock market full time. You can reach him at inquiry@tradersclassroom.com or by visiting his website at http://www.tradersclassroom.com. You can also follow him on Twitter @TradersClassrm.
PRINT THIS ARTICLE
TREND-CHANNEL
Silver Ready To Move Lower
08/04/08 10:12:36 AMby Alan R. Northam
Silver Standard Resources made a market top in late 2007 and has been trading lower this year. Over the last few months, SSRI has been in a narrow trading range that looks ready to break down and move lower.
Position: N/A
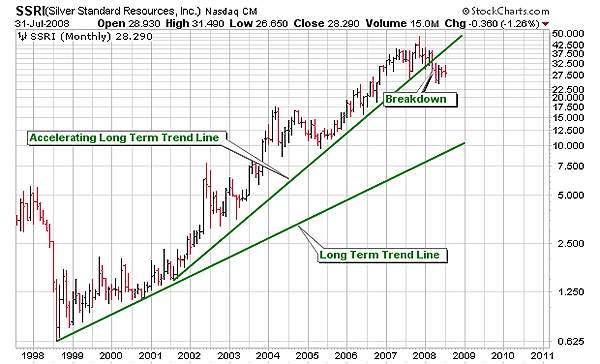
| Silver Standard Resources (SSRI) has been in a long-term bull market since 1998. In Figure 1, you can see two long-term trends drawn on the monthly chart. The more shallow long-term trendline is the original trendline drawn off the first reaction low set in 2000. From 2000 forward, SSRI accelerated and formed a steeper long-term trendline. This steeper trendline remained in place for six years without being penetrated, making it a strong line of support. However, early this year this strong line of support was broken when SSRI started to move lower. The breakdown of this trendline now signals that the acceleration period of higher prices for SSRI has ended and a new trend is now unfolding. There are several scenarios that can unfold for this new trend. SSRI could enter into a trading range and move sideways for many months as it consolidates its gains. Trading ranges are typically continuation patterns, which means that eventually the upward trend will continue. However, I am a little skeptical of this scenario since the price has broken down below the price minimum set in 2007. The second scenario is for SSRI to enter into an intermediate-term downward trend to correct for its overall gain. This is a likely senerio that we will evaluate further. The third scenario would be for SSRI to enter into a long-term downward trend or bear market. This also is a likely scenario but will not be confirmed until price breaks down below the more shallow long-term trendline. |

|
| FIGURE 1: SSRI, MONTHLY. This price chart of SSRI shows long-term trendlines and a breakdown. A breakdown of a trendline signals the end of that trend and the beginning of a new one. |
| Graphic provided by: StockCharts.com. |
| |
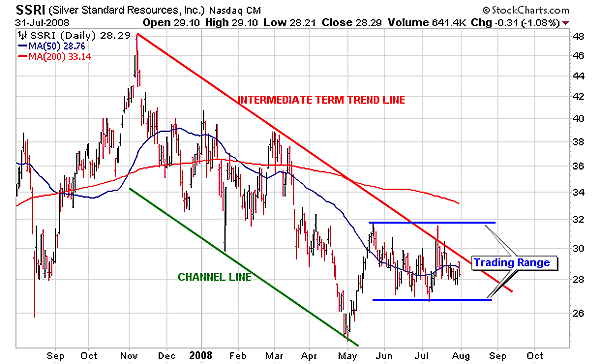
| Figure 2 shows the daily price chart for SSRI over the last 18 months. This chart shows that the SSRI has been in an intermediate-term downward trend over the last several months following its price peak in November 2007. Figure 2 shows SSRI bouncing off its channel line in early May to move higher as it corrected for its losses from March. This corrective bounce has since morphed into a narrow trading range. From June forward, SSRI has been trading within this trading range and is now up against the downsloping trendline. From mid-July to the present, it appears that SSRI is respecting the trendline by not breaking out above it. As a result, I expect SSRI to move lower in the days ahead to the lower edge of the trading range. The big question is, will SSRI eventually break out above the downward sloping trendline and retest the resistance of the upper edge of the trading range, or will it break down below the lower edge of the trading range and continue the selloff? To answer that question, we have to look at two things. First of all, trading ranges are consolidation patterns, which are continuation patterns. Therefore, the higher probability is for a continuation of the previous trend, which is downward. Second, we have to look at the relationship between the 50-day and the 200-day moving average. Here we see that the 50-day moving average is below the 50-day moving average, which indicates that the intermediate-term strength is to the downside. In addition, the 200-day moving average is moving lower, indicating that the longer-term strength of this market is also downward. At this time there is no evidence of any market strength to the upside, so the higher probability is for SSRI to continue to move lower in the days, weeks, and months ahead. Therefore, I would look for a breakdown in price below the current narrow trading range in the days ahead to signal the continuation of the downward trend. |

|
| FIGURE 2, SSRI, DAILY. This figure shows the intermediate-term trendline and channel line as well as a narrow trading range. Trading ranges are continuation patterns and signal the continuation of the downward trend once the price breaks down below the trading range. |
| Graphic provided by: StockCharts.com. |
| |
| To establish a good target price for this downward move, all we have to do is look at Figure 1. The next major line of support is the more shallow of the two long-term trendlines. This line of support is a good price target for silver over the next year or so. |
Alan Northam lives in the Dallas, Texas area and as an electronic engineer gave him an analytical mind from which he has developed a thorough knowledge of stock market technical analysis. His abilities to analyze the future direction of the stock market has allowed him to successfully trade of his own portfolio over the last 30 years. Mr. Northam is now retired and trading the stock market full time. You can reach him at inquiry@tradersclassroom.com or by visiting his website at http://www.tradersclassroom.com. You can also follow him on Twitter @TradersClassrm.
| Garland, Tx | |
| Website: | www.tradersclassroom.com |
| E-mail address: | inquiry@tradersclassroom.com |
Click here for more information about our publications!
PRINT THIS ARTICLE

Request Information From Our Sponsors
- StockCharts.com, Inc.
- Candle Patterns
- Candlestick Charting Explained
- Intermarket Technical Analysis
- John Murphy on Chart Analysis
- John Murphy's Chart Pattern Recognition
- John Murphy's Market Message
- MurphyExplainsMarketAnalysis-Intermarket Analysis
- MurphyExplainsMarketAnalysis-Visual Analysis
- StockCharts.com
- Technical Analysis of the Financial Markets
- The Visual Investor
- VectorVest, Inc.
- Executive Premier Workshop
- One-Day Options Course
- OptionsPro
- Retirement Income Workshop
- Sure-Fire Trading Systems (VectorVest, Inc.)
- Trading as a Business Workshop
- VectorVest 7 EOD
- VectorVest 7 RealTime/IntraDay
- VectorVest AutoTester
- VectorVest Educational Services
- VectorVest OnLine
- VectorVest Options Analyzer
- VectorVest ProGraphics v6.0
- VectorVest ProTrader 7
- VectorVest RealTime Derby Tool
- VectorVest Simulator
- VectorVest Variator
- VectorVest Watchdog
