HOT TOPICS LIST
- MACD
- Fibonacci
- RSI
- Gann
- ADXR
- Stochastics
- Volume
- Triangles
- Futures
- Cycles
- Volatility
- ZIGZAG
- MESA
- Retracement
- Aroon
INDICATORS LIST
LIST OF TOPICS
PRINT THIS ARTICLE
by James Kupfer
Exelon is sitting on a long-term trendline and may be ready to continue its trend.
Position: Buy
James Kupfer
Mr. Kupfer is a market professional and amateur stock market commentator. Disclosure: It is likely that Mr. Kupfer has or will enter a position in any security he writes about.
PRINT THIS ARTICLE
TREND-CHANNEL
Exelon At Trendline Support
08/04/08 09:28:44 AMby James Kupfer
Exelon is sitting on a long-term trendline and may be ready to continue its trend.
Position: Buy
| A significant trendline can be said to be formed by two linearly connected points along with a successful test of the trendline for a total of three points. The points that can be used to draw a trendline include highs, lows, or closes. The more times that a stock bounces off of its trendline, the more significant the trend is. Typically, I use the highs or lows to draw trendlines, but not a stock's close, although this is just a matter of preference. |
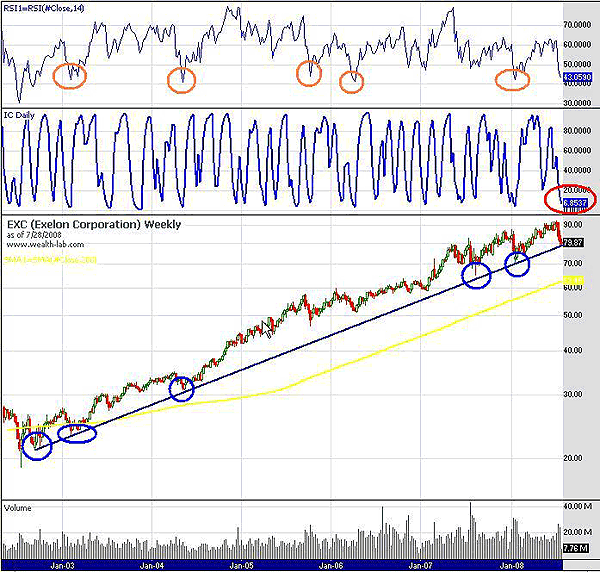
| As you can see from the weekly chart in Figure 1, Exelon (EXC) has tested its trendline at five different points (blue circles) since the initial formation point in September 2002. While it is a solid uptrend, it is not so steep as to be unsustainable. EXC has once again come to test its trendline and is thus in a potentially prime buying spot. |

|
| FIGURE 1: EXC, WEEKLY. Exelon has tested its trendline at five different points (blue circles) since the initial formation point in September 2002. |
| Graphic provided by: Wealth-Lab. |
| |
| Additional reasons to think it might be primed to resume its uptrend include the following: first, according to the stochastic formula I use, it is very oversold. Second, you will note that on top of the chart, the relative strength index (RSI) is plotted. As the orange circles indicate, each time EXC has dropped to an RSI value of near 40, it has bounced. The stock's RSI is once again approaching 40. See Figure 2. |

|
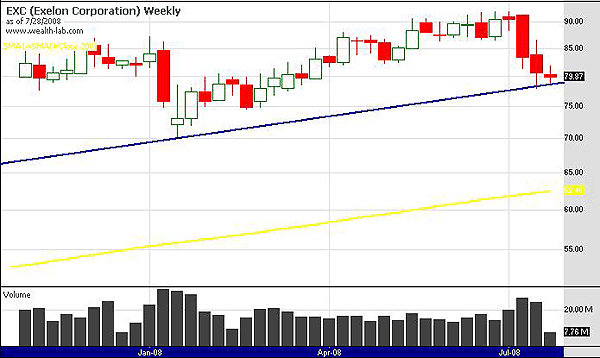
| FIGURE 2: EXC, WEEKLY. The stock could break its trendline to move lower, but ... |
| Graphic provided by: Wealth-Lab. |
| |
| Of course, the stock could very well break its trendline to move lower, but I like to see multiple indicators and price action supportive of a buy (or short, as the case may be). Always trade with a stop in any case, and good luck trading. |
Mr. Kupfer is a market professional and amateur stock market commentator. Disclosure: It is likely that Mr. Kupfer has or will enter a position in any security he writes about.
Click here for more information about our publications!
PRINT THIS ARTICLE

Request Information From Our Sponsors
- StockCharts.com, Inc.
- Candle Patterns
- Candlestick Charting Explained
- Intermarket Technical Analysis
- John Murphy on Chart Analysis
- John Murphy's Chart Pattern Recognition
- John Murphy's Market Message
- MurphyExplainsMarketAnalysis-Intermarket Analysis
- MurphyExplainsMarketAnalysis-Visual Analysis
- StockCharts.com
- Technical Analysis of the Financial Markets
- The Visual Investor
- VectorVest, Inc.
- Executive Premier Workshop
- One-Day Options Course
- OptionsPro
- Retirement Income Workshop
- Sure-Fire Trading Systems (VectorVest, Inc.)
- Trading as a Business Workshop
- VectorVest 7 EOD
- VectorVest 7 RealTime/IntraDay
- VectorVest AutoTester
- VectorVest Educational Services
- VectorVest OnLine
- VectorVest Options Analyzer
- VectorVest ProGraphics v6.0
- VectorVest ProTrader 7
- VectorVest RealTime Derby Tool
- VectorVest Simulator
- VectorVest Variator
- VectorVest Watchdog
