HOT TOPICS LIST
- MACD
- Fibonacci
- RSI
- Gann
- ADXR
- Stochastics
- Volume
- Triangles
- Futures
- Cycles
- Volatility
- ZIGZAG
- MESA
- Retracement
- Aroon
INDICATORS LIST
LIST OF TOPICS
PRINT THIS ARTICLE
by Chaitali Mohile
Gamestop Corp. is standing in strong support, waiting for the breakout. Will this rally establish the support and move ahead?
Position: N/A
Chaitali Mohile
Active trader in the Indian stock markets since 2003 and a full-time writer. Trading is largely based upon technical analysis.
PRINT THIS ARTICLE
GAPS
Can GME Continue The Rally?
08/04/08 11:42:35 AMby Chaitali Mohile
Gamestop Corp. is standing in strong support, waiting for the breakout. Will this rally establish the support and move ahead?
Position: N/A
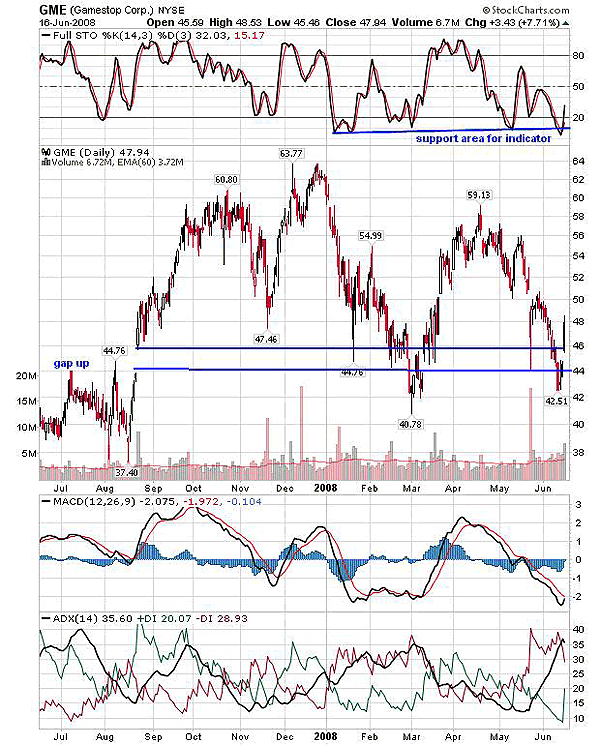
| Gaps get filled sooner or later. Prices retrace to test these support/resistance areas formed by the gap, and a robust move appears in index/equity stock. In 2007, Gamestop (GME) gapped up and jumped from $44 to $46 for an easy upside rally. This gap up move led the stock to significantly higher levels at 60 in mid-October 2007. The extended rally then retraced back to the gap support at 47 and rushed back, forming higher highs at 63 levels. The same support at 47 was challenged again in March 2008, but the declining rally moved below the support level, filling up the gap. This gap filling was followed by strong bullish notes, as the stochastic (14,3,3) moved down to the support zone in the oversold area, and the moving average convergence/divergence (MACD) (12,26,9) had been rallying in negative territory for a pretty long period. This indicated that both the indicators were ready for the bullish breakout and the increasing buying pressure weakened the downtrend. Accordingly, as the gap was filled, GME hurried in an upward direction. |

|
| FIGURE 1: GME, DAILY. The gap up that occurred in 2007 was filled twice in 2008. |
| Graphic provided by: StockCharts.com. |
| |
| Figure 1 shows that GME is back to the same support/resistance area near 46. The stock drifted from 59.13 to 42.51, and the gap was again filled. Recently, GME has a small gap up during its upward journey from the support level. Thus, the data with a larger time frame shows a stronger support zone and the high possibility of a positive bullish rally ahead. But the recent chart has to be verified closely to reconfirm the future move. |

|
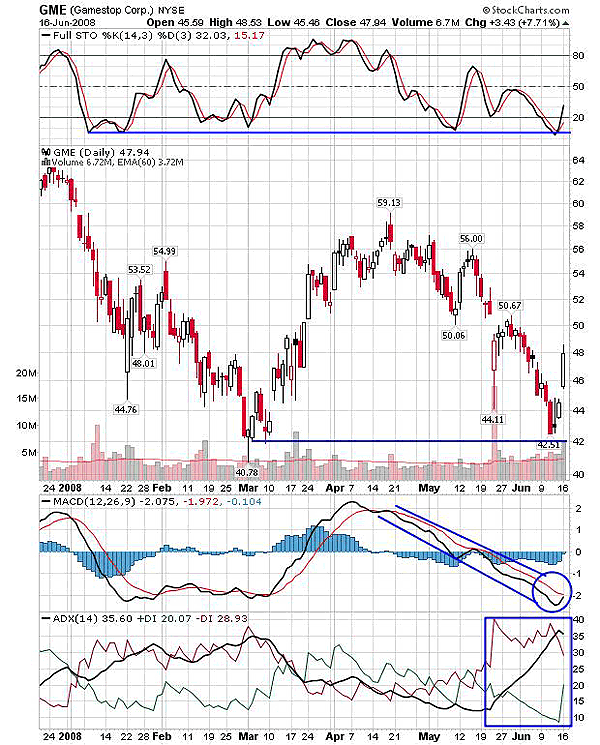
| FIGURE 2: GME, DAILY. Traders need to watch out for a confirmed breakout above the 50 levels. In addition, all three indicators should give confirmed bullish signals for a successful breakout rally. |
| Graphic provided by: StockCharts.com. |
| |
| In Figure 2, GME seems to have established support at the previous low of 42 and is likely to move up. The stochastic (14,3,3) is back to the same support area, and has already moved near the 50 level. Here, I feel jittery, as the oscillator can turn down under the 50 resistance level. On the other hand, the MACD (12,26,9) after a deep downside run is ready for the bullish crossover; the histogram has also moved above the zero line. Meanwhile, the downtrend is declining along with reducing selling pressure in ADX (14) and increasing buying pressure. |
| So though the support has been built up, the indicators currently have mixed signals. GME can be bought only if these indicators turn fully bullish, and a confirmed breakout is seen. The indicators have to move comfortably in bullish areas for the rally to move successfully. |
Active trader in the Indian stock markets since 2003 and a full-time writer. Trading is largely based upon technical analysis.
| Company: | Independent |
| Address: | C1/3 Parth Indraprasth Towers. Vastrapur |
| Ahmedabad, Guj 380015 | |
| E-mail address: | chaitalimohile@yahoo.co.in |
Traders' Resource Links | |
| Independent has not added any product or service information to TRADERS' RESOURCE. | |
Click here for more information about our publications!
PRINT THIS ARTICLE

Request Information From Our Sponsors
- StockCharts.com, Inc.
- Candle Patterns
- Candlestick Charting Explained
- Intermarket Technical Analysis
- John Murphy on Chart Analysis
- John Murphy's Chart Pattern Recognition
- John Murphy's Market Message
- MurphyExplainsMarketAnalysis-Intermarket Analysis
- MurphyExplainsMarketAnalysis-Visual Analysis
- StockCharts.com
- Technical Analysis of the Financial Markets
- The Visual Investor
- VectorVest, Inc.
- Executive Premier Workshop
- One-Day Options Course
- OptionsPro
- Retirement Income Workshop
- Sure-Fire Trading Systems (VectorVest, Inc.)
- Trading as a Business Workshop
- VectorVest 7 EOD
- VectorVest 7 RealTime/IntraDay
- VectorVest AutoTester
- VectorVest Educational Services
- VectorVest OnLine
- VectorVest Options Analyzer
- VectorVest ProGraphics v6.0
- VectorVest ProTrader 7
- VectorVest RealTime Derby Tool
- VectorVest Simulator
- VectorVest Variator
- VectorVest Watchdog
