HOT TOPICS LIST
- MACD
- Fibonacci
- RSI
- Gann
- ADXR
- Stochastics
- Volume
- Triangles
- Futures
- Cycles
- Volatility
- ZIGZAG
- MESA
- Retracement
- Aroon
INDICATORS LIST
LIST OF TOPICS
PRINT THIS ARTICLE
by Chaitali Mohile
After a long rally, crude oil is consolidating and is ready for breakout. This breakout may lead to a bloodbath in global financial markets.
Position: N/A
Chaitali Mohile
Active trader in the Indian stock markets since 2003 and a full-time writer. Trading is largely based upon technical analysis.
PRINT THIS ARTICLE
CONSOLID FORMATION
The Alarming Oil-Light Crude Move
08/01/08 12:46:06 PMby Chaitali Mohile
After a long rally, crude oil is consolidating and is ready for breakout. This breakout may lead to a bloodbath in global financial markets.
Position: N/A
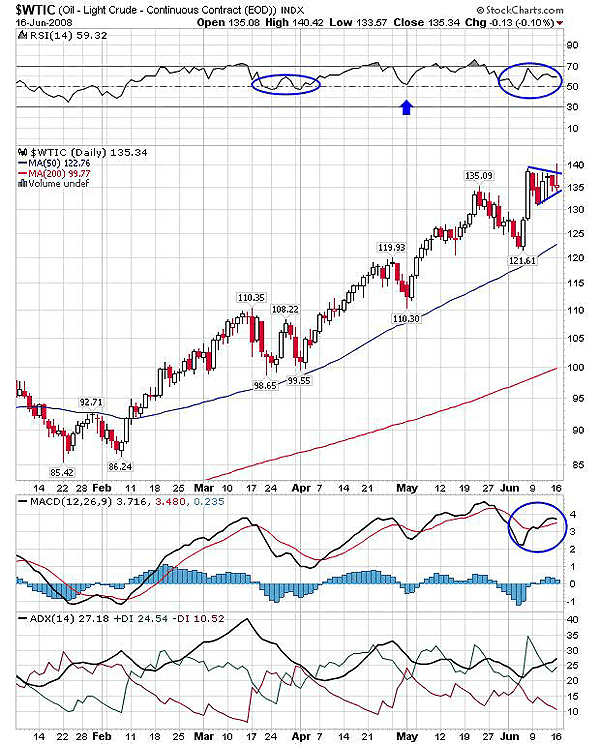
| The breakout of the oil-light crude ($WTIC) at $100 left global financial markets in shambles. The price hike continued at a greater pace, and inflation levels worsened globally. When the price of crude oil was at $135 you can see from Figure 1 that a breakout was a strong possibility. Earlier in May 2008, $WTIC declined from $135 to $120, but within a few trading sessions, the commodity was back to the previous level of $135. This indicated strong upside and a willingness to surge higher. In Figure 1, we can see oil consolidating in the range of $140 on the upper side and $132 on lower. The pattern formed is a bullish flag & pennant continuation, which breaks in an upward direction. So with this breakout the oil prices may climb the next step on the ladder, worsening global economic conditions. |

|
| FIGURE 1: $WTIC, DAILY. The flag & pennant pattern breakout may carry crude oil to new highs. |
| Graphic provided by: StockCharts.com. |
| |
| As we can see in Figure 1, the relative strength index (RSI) (14) has ranged in the 50-70 levels, indicating bullish strength throughout the rally. This rangebound movement can lead to the pattern breakout. The moving average convergence/divergence (MACD) (12,26,9) is bit volatile near the trigger line in positive territory. So under the present scenario, the bullish consolidation may soon violate the upper range. There is a possibility of crude oil dragging below $130 during the consolidation. The breakout would meet the minimum level of $159. We calculate the target by measuring the length of the flag pole 140 - 121 = 19 and adding this number to the breakout level of 140. This estimated level is the next destination for $WTIC. |

|
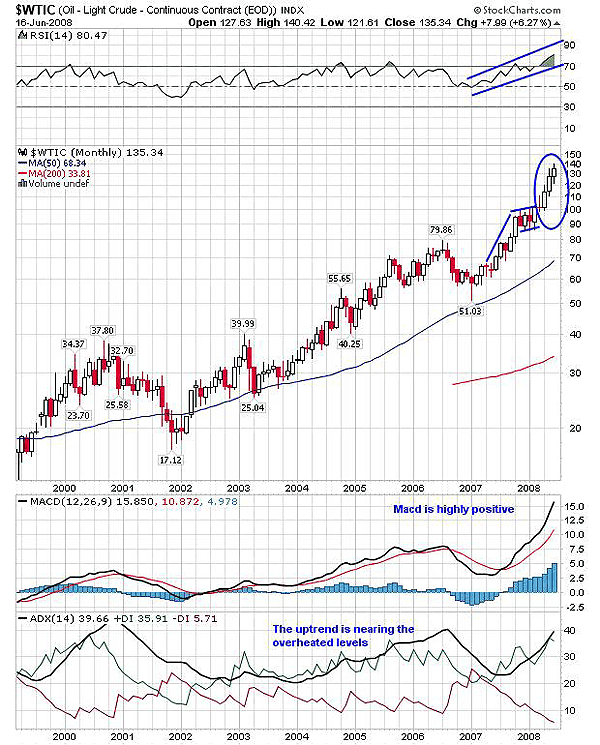
| FIGURE 2: $WTIC, MONTHLY. The RSI (14) and the MACD (12,26,9) has reached extreme bullish levels. The ADX (14) is about to enter the overheated uptrend. |
| Graphic provided by: StockCharts.com. |
| |
| In Figure 2, the breakout rally from $100 to $140 was seen with three white soldiers. The first two candles after the breakout reflect the strength in the rally, but the size of the third candle is comparatively smaller. The third candle shows bullish consolidation. The average directional movement index (ADX) (14) has moved near the overheated levels, and the MACD (12,26,9) and the RSI (14) have reached the highest bullish levels. Therefore, the indicators may decline to create further space for the rally. |

|
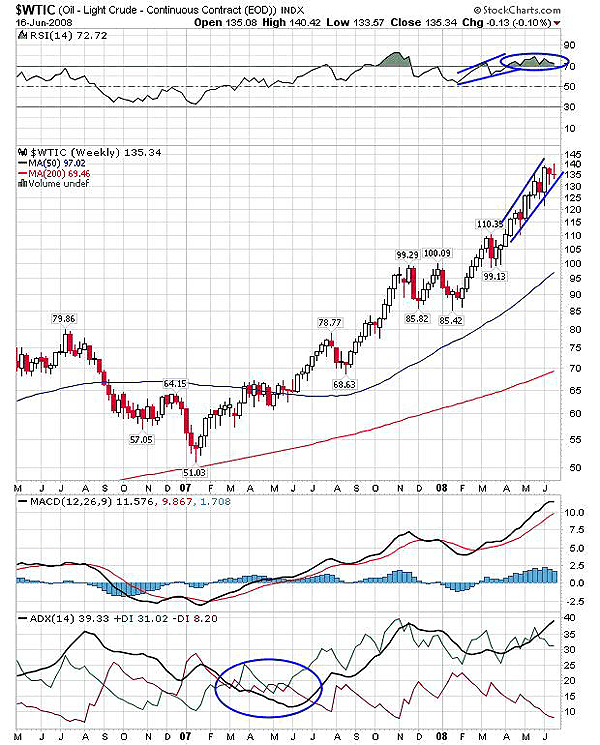
| FIGURE 3: $WTIC, WEEKLY. $WTIC has been in a strong uptrend since 2007. |
| Graphic provided by: StockCharts.com. |
| |
| Figure 3 shows $WTIC in a strong uptrend since 2007. The RSI (14) surged above 50 and has sustained in those bullish areas, with minor declines from overbought levels of 70. At $141, the RSI (14) has again reached 70 levels and established strong support, so the indicator is likely to move in an overbought area. The MACD (12,26,9) is highly positive in bullish territory, indicating a slow rise in the future. In addition, the ADX (14) is near the overheated levels. $WTIC is taking a steep upward move, so a sideways action is essential for accumulating bullish strength. |
| Thus, the present consolidation is a reaction to highly bullish indicators. This consolidation will soon undergo a robust breakout that will lead to a price hike of crude oil. This price hike may lead to a bloodbath in global financial markets. The range at both ends may be challenged till the breakout is confirmed. |
Active trader in the Indian stock markets since 2003 and a full-time writer. Trading is largely based upon technical analysis.
| Company: | Independent |
| Address: | C1/3 Parth Indraprasth Towers. Vastrapur |
| Ahmedabad, Guj 380015 | |
| E-mail address: | chaitalimohile@yahoo.co.in |
Traders' Resource Links | |
| Independent has not added any product or service information to TRADERS' RESOURCE. | |
Click here for more information about our publications!
Comments
Date: 08/04/08Rank: 2Comment:
Date: 08/05/08Rank: 5Comment:
Date: 08/12/08Rank: 5Comment:

Request Information From Our Sponsors
- StockCharts.com, Inc.
- Candle Patterns
- Candlestick Charting Explained
- Intermarket Technical Analysis
- John Murphy on Chart Analysis
- John Murphy's Chart Pattern Recognition
- John Murphy's Market Message
- MurphyExplainsMarketAnalysis-Intermarket Analysis
- MurphyExplainsMarketAnalysis-Visual Analysis
- StockCharts.com
- Technical Analysis of the Financial Markets
- The Visual Investor
- VectorVest, Inc.
- Executive Premier Workshop
- One-Day Options Course
- OptionsPro
- Retirement Income Workshop
- Sure-Fire Trading Systems (VectorVest, Inc.)
- Trading as a Business Workshop
- VectorVest 7 EOD
- VectorVest 7 RealTime/IntraDay
- VectorVest AutoTester
- VectorVest Educational Services
- VectorVest OnLine
- VectorVest Options Analyzer
- VectorVest ProGraphics v6.0
- VectorVest ProTrader 7
- VectorVest RealTime Derby Tool
- VectorVest Simulator
- VectorVest Variator
- VectorVest Watchdog
