

HOT TOPICS LIST
- MACD
- Fibonacci
- RSI
- Gann
- ADXR
- Stochastics
- Volume
- Triangles
- Futures
- Cycles
- Volatility
- ZIGZAG
- MESA
- Retracement
- Aroon
INDICATORS LIST
LIST OF TOPICS
PRINT THIS ARTICLE
by James Kupfer
American Express stands at a critical Fibonacci retracement level, but will it hold?
Position: Hold
James Kupfer
Mr. Kupfer is a market professional and amateur stock market commentator. Disclosure: It is likely that Mr. Kupfer has or will enter a position in any security he writes about.
PRINT THIS ARTICLE
FIBONACCI
A Warning On American Express
08/01/08 09:45:12 AMby James Kupfer
American Express stands at a critical Fibonacci retracement level, but will it hold?
Position: Hold
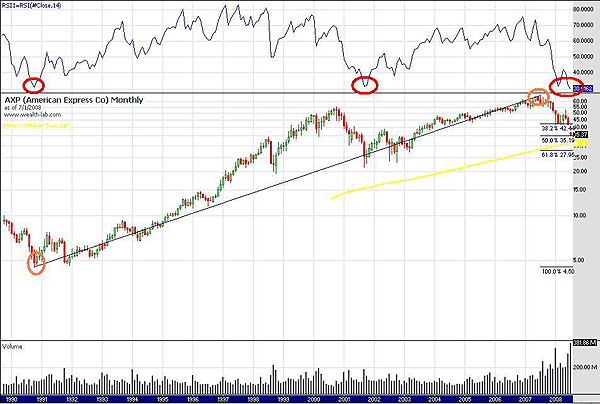
| Drawing Fibonacci retracement levels from the low of American Express (AXP) in 1990 to its top in 2007 (Figure 1, orange circles), you can see that AXP is now at the 50% retracement level. In addition, you can see that the relative strength index (RSI) is right around 30 (red circles), which is roughly the same level that it has reached at each of its last major bottoms. |
|
| FIGURE 1: AXP, MONTHLY. Drawing Fibonacci retracement levels from the low of American Express in 1990 to its top in 2007 (orange circles), you can see that AXP is now at the 50% retracement level. |
| Graphic provided by: Wealth-Lab. |
| |
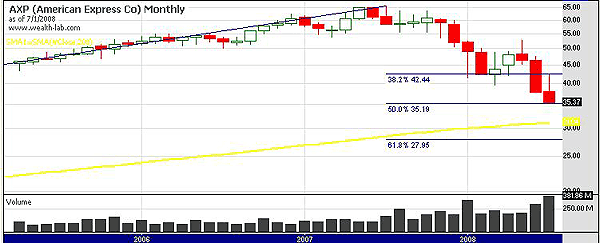
| You can see the Fibonacci levels better in the closeup graph of the monthly chart in Figure 2. |

|
| FIGURE 2: AXP, MONTHLY. Note the Fibonacci levels here. |
| Graphic provided by: Wealth-Lab. |
| |
| So while there are some positives for establishing a long-term position in AXP, I see some warning signs. Looking again at the RSI, if you look closely you will see that it dropped to around 30 in early 2008, bounced, and has now turned back down. This is unlike its previous bottoms in 1990 and 2001, where it hit a bottom and made a significant recovery without pause to above 50. The RSI is now lower than any time since 1990. See Figure 3. |
|
| FIGURE 3: AXP, MONTHLY. If you look closely, you will see that the RSI dropped to around 30 in early 2008, bounced, and has now turned back down. |
| Graphic provided by: Wealth-Lab. |
| |
| Moving to a daily time frame, the story is not much better. AXP has been in an established downtrend since early May. This can be seen clearly by looking at the linear regression channel I have drawn. Just two weeks ago AXP tried to break out of the channel but failed, and as such is still trending down. |
| Bottom line: AXP is flashing warning signs that it may not hold the 50% retracement level. From a monthly standpoint, the next stop would be the 38% retracement level at $27.95. |
Mr. Kupfer is a market professional and amateur stock market commentator. Disclosure: It is likely that Mr. Kupfer has or will enter a position in any security he writes about.
Click here for more information about our publications!
Comments

Request Information From Our Sponsors
- StockCharts.com, Inc.
- Candle Patterns
- Candlestick Charting Explained
- Intermarket Technical Analysis
- John Murphy on Chart Analysis
- John Murphy's Chart Pattern Recognition
- John Murphy's Market Message
- MurphyExplainsMarketAnalysis-Intermarket Analysis
- MurphyExplainsMarketAnalysis-Visual Analysis
- StockCharts.com
- Technical Analysis of the Financial Markets
- The Visual Investor
- VectorVest, Inc.
- Executive Premier Workshop
- One-Day Options Course
- OptionsPro
- Retirement Income Workshop
- Sure-Fire Trading Systems (VectorVest, Inc.)
- Trading as a Business Workshop
- VectorVest 7 EOD
- VectorVest 7 RealTime/IntraDay
- VectorVest AutoTester
- VectorVest Educational Services
- VectorVest OnLine
- VectorVest Options Analyzer
- VectorVest ProGraphics v6.0
- VectorVest ProTrader 7
- VectorVest RealTime Derby Tool
- VectorVest Simulator
- VectorVest Variator
- VectorVest Watchdog