HOT TOPICS LIST
- MACD
- Fibonacci
- RSI
- Gann
- ADXR
- Stochastics
- Volume
- Triangles
- Futures
- Cycles
- Volatility
- ZIGZAG
- MESA
- Retracement
- Aroon
INDICATORS LIST
LIST OF TOPICS
PRINT THIS ARTICLE
by Arthur Hill
After returning to broken resistance with a sharp decline in July, the streetTRACKS Gold ETF formed a small consolidation, and there is a big test at hand.
Position: Hold
Arthur Hill
Arthur Hill is currently editor of TDTrader.com, a website specializing in trading strategies, sector/industry specific breadth stats and overall technical analysis. He passed the Society of Technical Analysts (STA London) diploma exam with distinction is a Certified Financial Technician (CFTe). Prior to TD Trader, he was the Chief Technical Analyst for Stockcharts.com and the main contributor to the ChartSchool.
PRINT THIS ARTICLE
CONSOLID FORMATION
Gold Tests The Breakout
07/29/08 09:18:20 AMby Arthur Hill
After returning to broken resistance with a sharp decline in July, the streetTRACKS Gold ETF formed a small consolidation, and there is a big test at hand.
Position: Hold
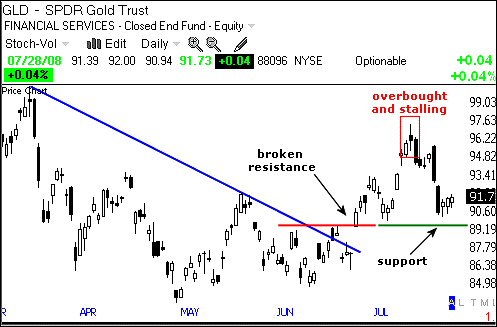
| Figure 1 shows the streetTRACKS Gold ETF (GLD) over the last five months. The ETF firmed in the mid-80s from late April to early June and then broke resistance with a surge in late June. The breakout featured a gap, a trendline break, and a move above the early June highs. This powerful breakout carried GLD above 95. |

|
| FIGURE 1: GLD, DAILY. This ETF firmed in the late 80s from late April to early June and then broke resistance with a surge in late June. |
| Graphic provided by: TeleChart2007. |
| |
| After becoming overbought in mid-July, GLD stalled and then declined with a sharp pullback. Despite such a sharp decline, the ETF is finding support near broken resistance around 90. This is the moment of truth for gold. A successful best would keep the June breakout alive and uptrend in play. Failure to hold support would negate the breakout and argue for a test of the May–June lows. |

|
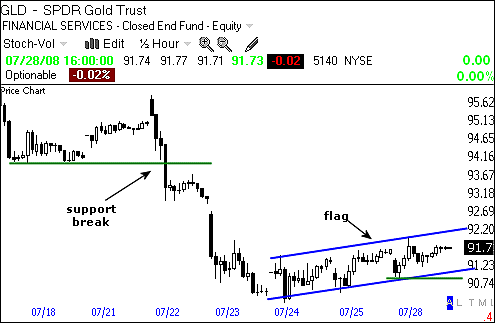
| FIGURE 2: GLD, 30-MINUTES. Here, GLD broke support with a sharp decline in July and then firmed in the low 90s. |
| Graphic provided by: TeleChart2007. |
| |
| For an expanded view of the three-day consolidation, I am looking at a 30-minute candlestick chart. GLD broke support with a sharp decline in July and then firmed in the low 90s. The slight advance over the last few days looks like a rising flag, which is potentially bearish. Flags are corrective patterns that slope opposite the bigger trend. A bearish flag slopes up and a bullish flag slopes down. This rising flag looks like a corrective rally to alleviate short-term oversold conditions. A break below flag support would signal a continuation of the prior decline. |
Arthur Hill is currently editor of TDTrader.com, a website specializing in trading strategies, sector/industry specific breadth stats and overall technical analysis. He passed the Society of Technical Analysts (STA London) diploma exam with distinction is a Certified Financial Technician (CFTe). Prior to TD Trader, he was the Chief Technical Analyst for Stockcharts.com and the main contributor to the ChartSchool.
| Title: | Editor |
| Company: | TDTrader.com |
| Address: | Willem Geetsstraat 17 |
| Mechelen, B2800 | |
| Phone # for sales: | 3215345465 |
| Website: | www.tdtrader.com |
| E-mail address: | arthurh@tdtrader.com |
Traders' Resource Links | |
| TDTrader.com has not added any product or service information to TRADERS' RESOURCE. | |
Click here for more information about our publications!
Comments
Date: 07/30/08Rank: 4Comment:
Date: 08/12/08Rank: 5Comment:

|

Request Information From Our Sponsors
- StockCharts.com, Inc.
- Candle Patterns
- Candlestick Charting Explained
- Intermarket Technical Analysis
- John Murphy on Chart Analysis
- John Murphy's Chart Pattern Recognition
- John Murphy's Market Message
- MurphyExplainsMarketAnalysis-Intermarket Analysis
- MurphyExplainsMarketAnalysis-Visual Analysis
- StockCharts.com
- Technical Analysis of the Financial Markets
- The Visual Investor
- VectorVest, Inc.
- Executive Premier Workshop
- One-Day Options Course
- OptionsPro
- Retirement Income Workshop
- Sure-Fire Trading Systems (VectorVest, Inc.)
- Trading as a Business Workshop
- VectorVest 7 EOD
- VectorVest 7 RealTime/IntraDay
- VectorVest AutoTester
- VectorVest Educational Services
- VectorVest OnLine
- VectorVest Options Analyzer
- VectorVest ProGraphics v6.0
- VectorVest ProTrader 7
- VectorVest RealTime Derby Tool
- VectorVest Simulator
- VectorVest Variator
- VectorVest Watchdog
