HOT TOPICS LIST
- MACD
- Fibonacci
- RSI
- Gann
- ADXR
- Stochastics
- Volume
- Triangles
- Futures
- Cycles
- Volatility
- ZIGZAG
- MESA
- Retracement
- Aroon
INDICATORS LIST
LIST OF TOPICS
PRINT THIS ARTICLE
by Alan R. Northam
IBM made a market peak in 1999, a price minimum in 2002, and has been in a recovery rally since. Now, however, IBM has run back up to its market price peak set in 1999 and may not be able to break out above it.
Position: N/A
Alan R. Northam
Alan Northam lives in the Dallas, Texas area and as an electronic engineer gave him an analytical mind from which he has developed a thorough knowledge of stock market technical analysis. His abilities to analyze the future direction of the stock market has allowed him to successfully trade of his own portfolio over the last 30 years. Mr. Northam is now retired and trading the stock market full time. You can reach him at inquiry@tradersclassroom.com or by visiting his website at http://www.tradersclassroom.com. You can also follow him on Twitter @TradersClassrm.
PRINT THIS ARTICLE
TREND-CHANNEL
Big Blue Hits Major Resistance
07/29/08 11:25:00 AMby Alan R. Northam
IBM made a market peak in 1999, a price minimum in 2002, and has been in a recovery rally since. Now, however, IBM has run back up to its market price peak set in 1999 and may not be able to break out above it.
Position: N/A
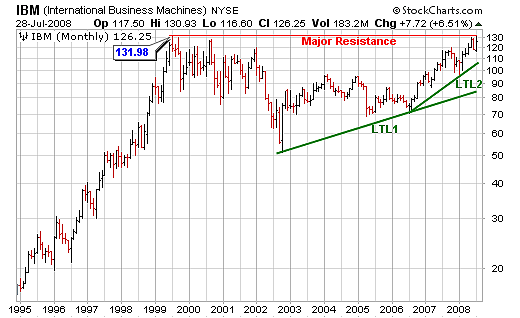
| IBM -- nicknamed Big Blue -- has not been doing too badly since the Dow Jones Industrial Average (DJIA) topped last year and has been trading downward ever since. While the DJIA has been falling, Big Blue has been on the upward swing -- but IBM may have run into a major road block. Figure 1 shows a chart of IBM since 1995; this market made a major top in 1999 of $131.98 per share. Since then, IBM traded downward to just above $50 per share in 2002 and has been in a recovery rally for the past six years. The high price set in 1999 proved to be too high for IBM, and since it has not been surpassed for nine years, the stock price has become a line of major resistance to this stock. In May 2008, IBM ran back into this line of major resistance and has not been able to break out above it for the last two months. Figure 1 also shows two long-term trendlines (LTL1 and LTL2). LTL2 shows that over the last two years, IBM has picked up a little momentum as its long-term trendline has become more steep. |

|
| FIGURE 1: IBM, MONTHLY. Monthly price bars show a major resistance line and long-term trendlines LTL1 and LTL2. |
| Graphic provided by: StockCharts.com. |
| |
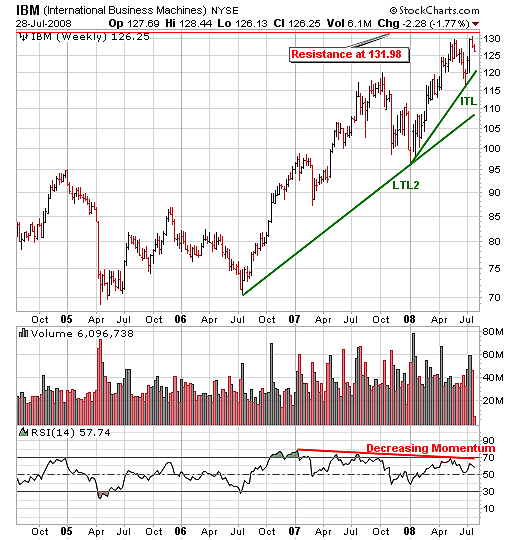
| Figure 2 is that of the weekly chart of IBM and zeroes in on long-term trendline 2. The main point to be made by this chart is pointed out by the relative strength index (RSI) below the price chart. While the monthly chart has shown that over the last two years, momentum has been picking up, RSI shows that over the last 18 months, momentum has been decelerating. As price keeps making higher and higher peaks, RSI has been making lower and lower peaks. This phenomenon is known as a divergence and carries with it negative connotations. This may be our first sign of potential problems for Big Blue. Figure 2 also shows that a steeper intermediate-term trendline (ITL) has been in progress since the beginning of this year. Note that while price peaks of each rally during this intermediate uptrend has been higher and higher, volume peaks have been falling lower and lower. Decreasing volume while price is approaching a major resistance line is not a formula for a successful price breakout above this major line of resistance. What appears to be taking place is that price is starting to feel the pressure of this line of major resistance and buyers are starting to back off. This could be another sign of potential problems for Big Blue. |

|
| FIGURE 2: IBM, WEEKLY. This weekly price chart of IBM shows long-term trendline LTL2 and intermediate-term trendline ITL. Figure 2 also shows decreasing momentum on the RSI chart. |
| Graphic provided by: StockCharts.com. |
| |
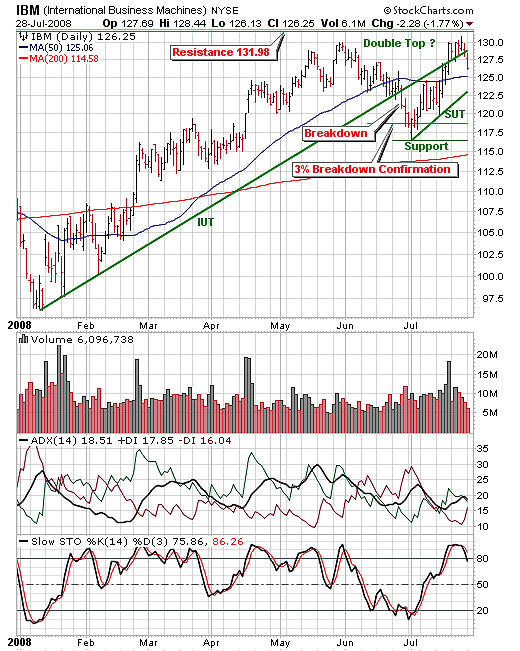
| Figure 3 is the daily chart of IBM showing the intermediate-term upward trendline (IUT). This chart shows that this upward trendline was broken in June of this year. A broken trendline signals the end of that trend and the beginning of a new one. IBM did not only break the trendline in June; it decisively broke the trendline by falling more than 3% after the break. The 3% rule helps to confirm a valid trendline break. Since then, IBM has found some short-term support between 115 and 117.5 and has been trading upward to retest that long-standing major line of support at 131.98 and now looks to be turning back downward. Note that the price peak made just a few days ago is just slightly higher than the price peak made at the end of May. It appears that a double top reversal pattern could be in the making, but that will not be confirmed until IBM closes below the support line drawn off the low price set at the end of June. With the breaking down of the intermediate-term upward trendline, a new downward trend looks to be developing. For Elliotticians, the rally from the end of June has unfolded in a three-wave ABC zigzag formation indicating that the rally is corrective in nature. This is a clue that the next movement in price for this stock will be in the downward direction. Further note that over the course of the last seven trading sessions, volume has been decreasing, signaling that IBM is backing off from its test of the major resistance line. Thus, the daily chart also shows signs of potential problems for Big Blue. |

|
| FIGURE 3: IBM, DAILY. The daily price chart of IBM shows the breakdown of the intermediate-term upward trendline and the formation of a possible double-top reversal signal. Figure 3 also shows the average directional movement index (ADX) below 20 signaling a lack of trend and the stochastic oscillator turning downward, signaling the beginning of a selloff. |
| Graphic provided by: StockCharts.com. |
| |
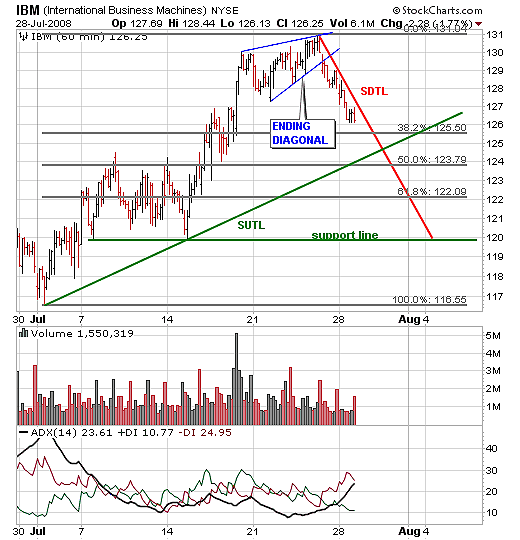
| Figure 4 shows the 60-minute price chart of IBM. This chart shows an ending diagonal pattern. Ending diagonal patterns are trend reversal patterns that show up at the end of a corrective rally. As I mentioned previously, the rally from the end of June has taken the form of an ABC zigzag corrective rally, and ending diagonal patterns, if they develop, normally appear at the end of corrective rallies. Therefore, this ending diagonal pattern is signaling the completion of the corrective rally and the beginning of a new downtrend. Looking at the price chart, we see that over the last few days, IBM has started to trend lower, as it has now moved below the beginning of the ending diagonal pattern. I have added the short-term upward trendline (SUTL), a support line at 120, and the Fibonacci retracement lines. These are all possible areas of support that could stop the decline and must be watched closely. However, a 100% retracement to below the price minimum set at the end of June will signal the completion of the double-top reversal pattern and signal a continued downward trend. Figure 4 also shows that IBM could be in big trouble. |

|
| FIGURE 4: IBM, HOURLY. The 60-minute price chart of IBM shows the ending diagonal reversal pattern. This chart also shows that IBM has now started to trend downward. The ADX is now above 20, signaling that a downward trend is starting to develop. |
| Graphic provided by: StockCharts.com. |
| |
| Although I do not see any areas of encouragement that IBM could continue to move higher in the days, weeks, and months ahead, I also do not yet see any real technical damage having been done. However, all the evidence presented points to the fact that IBM could suffer technical damage as we go ahead from here. Watch IBM from here on out. If IBM turns back upward and manages to break out above its long-term major resistance line at 131.98, then IBM will be set to continue higher. However, should IBM fall below 116, then the double-top reversal pattern will have been confirmed and this market will undoubtedly continue to move lower. |
Alan Northam lives in the Dallas, Texas area and as an electronic engineer gave him an analytical mind from which he has developed a thorough knowledge of stock market technical analysis. His abilities to analyze the future direction of the stock market has allowed him to successfully trade of his own portfolio over the last 30 years. Mr. Northam is now retired and trading the stock market full time. You can reach him at inquiry@tradersclassroom.com or by visiting his website at http://www.tradersclassroom.com. You can also follow him on Twitter @TradersClassrm.
| Garland, Tx | |
| Website: | www.tradersclassroom.com |
| E-mail address: | inquiry@tradersclassroom.com |
Click here for more information about our publications!
Comments
Date: 07/30/08Rank: 4Comment:
Date: 07/31/08Rank: 4Comment:

Request Information From Our Sponsors
- StockCharts.com, Inc.
- Candle Patterns
- Candlestick Charting Explained
- Intermarket Technical Analysis
- John Murphy on Chart Analysis
- John Murphy's Chart Pattern Recognition
- John Murphy's Market Message
- MurphyExplainsMarketAnalysis-Intermarket Analysis
- MurphyExplainsMarketAnalysis-Visual Analysis
- StockCharts.com
- Technical Analysis of the Financial Markets
- The Visual Investor
- VectorVest, Inc.
- Executive Premier Workshop
- One-Day Options Course
- OptionsPro
- Retirement Income Workshop
- Sure-Fire Trading Systems (VectorVest, Inc.)
- Trading as a Business Workshop
- VectorVest 7 EOD
- VectorVest 7 RealTime/IntraDay
- VectorVest AutoTester
- VectorVest Educational Services
- VectorVest OnLine
- VectorVest Options Analyzer
- VectorVest ProGraphics v6.0
- VectorVest ProTrader 7
- VectorVest RealTime Derby Tool
- VectorVest Simulator
- VectorVest Variator
- VectorVest Watchdog
