

HOT TOPICS LIST
- MACD
- Fibonacci
- RSI
- Gann
- ADXR
- Stochastics
- Volume
- Triangles
- Futures
- Cycles
- Volatility
- ZIGZAG
- MESA
- Retracement
- Aroon
INDICATORS LIST
LIST OF TOPICS
PRINT THIS ARTICLE
by Chaitali Mohile
Addax Petroleum failed to establish support at 52-week highs. Profit booking might be a wise decision at this point.
Position: N/A
Chaitali Mohile
Active trader in the Indian stock markets since 2003 and a full-time writer. Trading is largely based upon technical analysis.
PRINT THIS ARTICLE
STRATEGIES
Book Profit With Addax Petroleum
07/28/08 01:20:22 PMby Chaitali Mohile
Addax Petroleum failed to establish support at 52-week highs. Profit booking might be a wise decision at this point.
Position: N/A
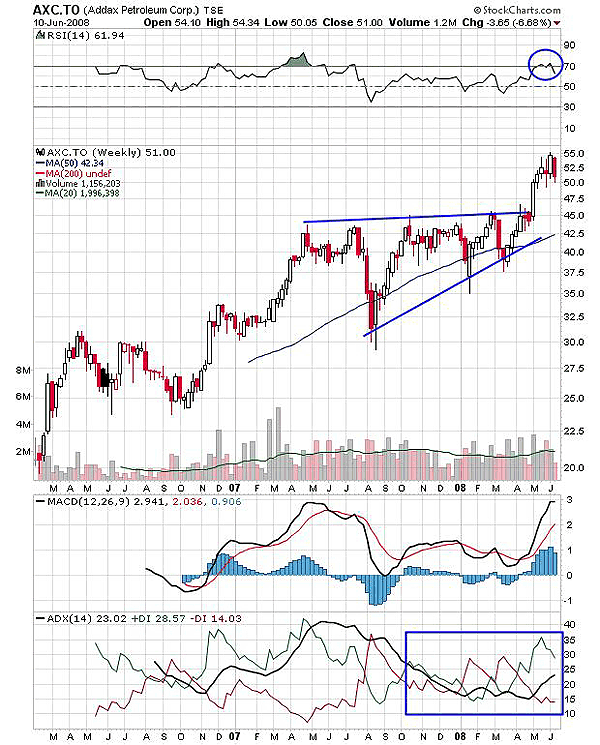
| Addax Petroleum moved out of the triangular formation it had been in and made a 52-week high at about the 55 level. The triangle formed and had a stable upper range at 45 while the lower range had higher lows. The volume during the triangle formation showed high volatility. The distance between the two ranges of the triangle was large, and the trading within the range might be the reason for the volatility. The widest distance between the upper and lower range is 45 - 30 = 15, so the breakout target would be 45 + 15 = 60. The stock broke off the pattern and rallied higher, hitting a 52-week high. Figure 1 shows that Addax Petroleum (AXC.TO) was reluctant to carry the rally toward the estimated level. |
|
| FIGURE 1: AXC.TO, WEEKLY. Lack of bullish strength may result in a freefall. AXC.TO may plunge to a lower support of 42.5. |
| Graphic provided by: StockCharts.com. |
| |
| The relative strength index (RSI) (14) is declining under the resistance of 70, which is alarming, as the momentum indicator has never moved above those overbought levels. The positive directional index (+DI) of the trend indicator edged down, indicating reducing buying pressure (see Figure 1). The decreasing buying pressure may slow the uptrend. In such bearish conditions, the stock may not rise higher. |
|
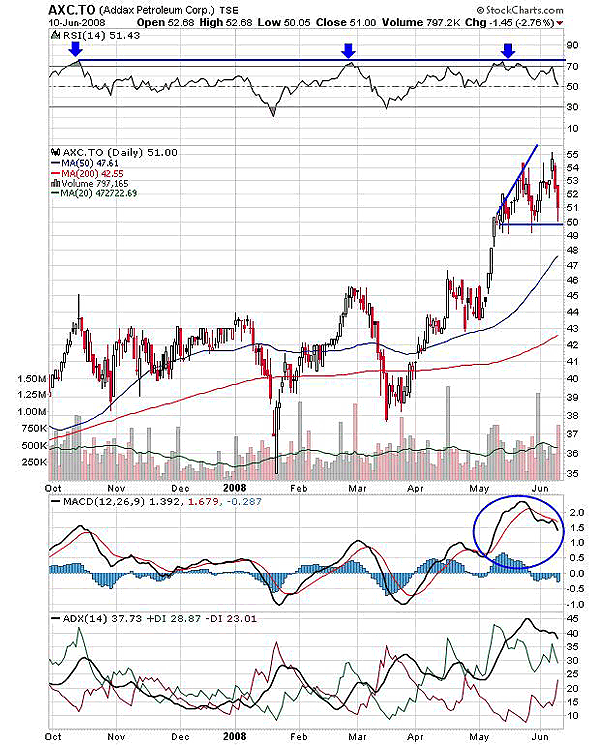
| FIGURE 2: AXC.TO, DAILY. The RSI (14) and the MACD (12,26,9) are declining from the bullish levels. The ADX (14) is descending from the overheated area. |
| Graphic provided by: StockCharts.com. |
| |
| In Figure 2, the RSI (14) recovered sharply from the oversold and overbought levels. Since March 2008, the momentum indicator has sustained above the 50 level, indicating bullish strength in the current rally. The fresh uptrend accelerated the rally to move above the upper range of 45. The breakout thus had bullish strength to continue the rally. At 50, the stock formed a stable low and higher high. As the price reached a new high, AXC.TO failed to continue the rally and retraced back to the previous low of 50. The trading session of June 10 closed at the same support level. If in the future this support is violated, then the entire profit on the previous rally would vanish. |
| In addition, the bearish strength might increase if the RSI (14) slipped below the golden support at 50. The declining moving average convergence/divergence (MACD) (12,26,9) indicates a diminishing bullish force on the rally. Also, the uptrend appears to be descending from overheated levels (see Figure 2). |
| This weak background can bring AXC.TO back to a lower support of 42.5. Considering these bearish signals, I would recommend profit booking at the current levels. |
Active trader in the Indian stock markets since 2003 and a full-time writer. Trading is largely based upon technical analysis.
| Company: | Independent |
| Address: | C1/3 Parth Indraprasth Towers. Vastrapur |
| Ahmedabad, Guj 380015 | |
| E-mail address: | chaitalimohile@yahoo.co.in |
Traders' Resource Links | |
| Independent has not added any product or service information to TRADERS' RESOURCE. | |
Click here for more information about our publications!
PRINT THIS ARTICLE

Request Information From Our Sponsors
- StockCharts.com, Inc.
- Candle Patterns
- Candlestick Charting Explained
- Intermarket Technical Analysis
- John Murphy on Chart Analysis
- John Murphy's Chart Pattern Recognition
- John Murphy's Market Message
- MurphyExplainsMarketAnalysis-Intermarket Analysis
- MurphyExplainsMarketAnalysis-Visual Analysis
- StockCharts.com
- Technical Analysis of the Financial Markets
- The Visual Investor
- VectorVest, Inc.
- Executive Premier Workshop
- One-Day Options Course
- OptionsPro
- Retirement Income Workshop
- Sure-Fire Trading Systems (VectorVest, Inc.)
- Trading as a Business Workshop
- VectorVest 7 EOD
- VectorVest 7 RealTime/IntraDay
- VectorVest AutoTester
- VectorVest Educational Services
- VectorVest OnLine
- VectorVest Options Analyzer
- VectorVest ProGraphics v6.0
- VectorVest ProTrader 7
- VectorVest RealTime Derby Tool
- VectorVest Simulator
- VectorVest Variator
- VectorVest Watchdog