HOT TOPICS LIST
- MACD
- Fibonacci
- RSI
- Gann
- ADXR
- Stochastics
- Volume
- Triangles
- Futures
- Cycles
- Volatility
- ZIGZAG
- MESA
- Retracement
- Aroon
INDICATORS LIST
LIST OF TOPICS
PRINT THIS ARTICLE
by David Penn
As CACI International advances from 28 to 43 in less than two months, CACI longs celebrate the benevolent dictatorship of volume.
Position: N/A
David Penn
Technical Writer for Technical Analysis of STOCKS & COMMODITIES magazine, Working-Money.com, and Traders.com Advantage.
PRINT THIS ARTICLE
VOLUME
Volume Rules: CACI International's Spring Climb
05/25/01 12:16:12 PMby David Penn
As CACI International advances from 28 to 43 in less than two months, CACI longs celebrate the benevolent dictatorship of volume.
Position: N/A
| One axiom of technical analysis suggests that while prices may fall of their own weight, only volume can drive prices higher over time. The spring advance of CACI International, an information systems and high technology "solutions" company out of Virginia, is one of the best examples of this phenomenon I've seen in this spring rally. |
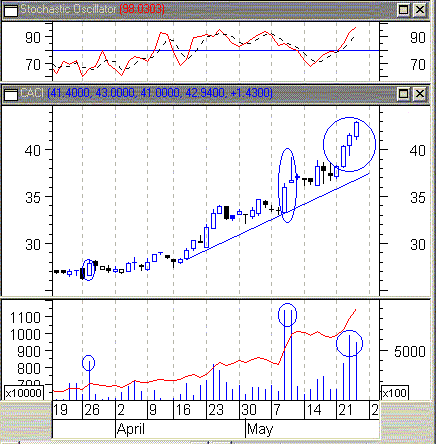
| CACI was moving in a tight consolidation from mid-February into late March when the first significant high volume day occurred on March 27th. The uptick in on-balance volume (overlaid on the volume chart) supports the heavy buying, as does the bullish candlestick. Even though CACI continued to trade in a very tight range for another three weeks, the heavy volume day on March 27th was a tip-off that buyers were interested in seeing this stock go up--moreso than sellers were looking to get out of their positions. From the beginning of the year until the first big up moves in late April, CACI has advanced from about 22.5 to 28. While this 24% increase is a more than reasonable return, the rising on-balance volume strongly suggested that holders of the stock believed there was more to come. |

|
| Figure 1: Upticks in on-balance volume during high volume days signify bullishness. More buyers means a greater interest in seeing CACI continue to climb. |
| Graphic provided by: MetaStock. |
| |
| In most cases, given a market with a neutral or mildly bullish bias, the only thing that would keep a stock like CACI down (outside of a catastrophic event) would be the determination of holders to sell, which is not reflected in the rising on-balance volume, nor in the tightness of the consolidation--particularly between late February and early April. |
| As good as the returns from CACI were from January to late April, the advance from late April to late May was nothing short of spectacular, In about 30 days, CACI climbed over 53%, largely on the backs of heavy buying on May 9th and 10th, as well as on the 22nd, 23rd, and 24th. Unlike many high-volume, high percentage moves, CACI's advance had almost no gaps. In fact, each advance was supported by a significant support area of at least two weeks. Nearest support currently is at 36.5 as the stock trades in the low 40s. |
| The importance of these small support areas is that the advance is more likely to be sustainable if there are areas to which CACI can retreat. The pair of two to three week support areas here can function as places where selling can occur without overly disrupting any renewed advance. This is in contrast to what are commonly called "V" advances in which stocks that have declined rocket upwards without pause, often reaping brief, but fleeting gains. Advances that come with both heavy volume and short-term support "platforms" are much more likely to provide reasonable entry points than those without. |
Technical Writer for Technical Analysis of STOCKS & COMMODITIES magazine, Working-Money.com, and Traders.com Advantage.
| Title: | Technical Writer |
| Company: | Technical Analysis, Inc. |
| Address: | 4757 California Avenue SW |
| Seattle, WA 98116 | |
| Phone # for sales: | 206 938 0570 |
| Fax: | 206 938 1307 |
| Website: | www.Traders.com |
| E-mail address: | DPenn@traders.com |
Traders' Resource Links | |
| Charting the Stock Market: The Wyckoff Method -- Books | |
| Working-Money.com -- Online Trading Services | |
| Traders.com Advantage -- Online Trading Services | |
| Technical Analysis of Stocks & Commodities -- Publications and Newsletters | |
| Working Money, at Working-Money.com -- Publications and Newsletters | |
| Traders.com Advantage -- Publications and Newsletters | |
| Professional Traders Starter Kit -- Software | |
Click here for more information about our publications!
Comments

Request Information From Our Sponsors
- VectorVest, Inc.
- Executive Premier Workshop
- One-Day Options Course
- OptionsPro
- Retirement Income Workshop
- Sure-Fire Trading Systems (VectorVest, Inc.)
- Trading as a Business Workshop
- VectorVest 7 EOD
- VectorVest 7 RealTime/IntraDay
- VectorVest AutoTester
- VectorVest Educational Services
- VectorVest OnLine
- VectorVest Options Analyzer
- VectorVest ProGraphics v6.0
- VectorVest ProTrader 7
- VectorVest RealTime Derby Tool
- VectorVest Simulator
- VectorVest Variator
- VectorVest Watchdog
- StockCharts.com, Inc.
- Candle Patterns
- Candlestick Charting Explained
- Intermarket Technical Analysis
- John Murphy on Chart Analysis
- John Murphy's Chart Pattern Recognition
- John Murphy's Market Message
- MurphyExplainsMarketAnalysis-Intermarket Analysis
- MurphyExplainsMarketAnalysis-Visual Analysis
- StockCharts.com
- Technical Analysis of the Financial Markets
- The Visual Investor
