HOT TOPICS LIST
- MACD
- Fibonacci
- RSI
- Gann
- ADXR
- Stochastics
- Volume
- Triangles
- Futures
- Cycles
- Volatility
- ZIGZAG
- MESA
- Retracement
- Aroon
INDICATORS LIST
LIST OF TOPICS
PRINT THIS ARTICLE
by Chaitali Mohile
Comerica is in an intermediate downtrend, and the highly bearish indicators suggest a relief rally could be under way.
Position: N/A
Chaitali Mohile
Active trader in the Indian stock markets since 2003 and a full-time writer. Trading is largely based upon technical analysis.
PRINT THIS ARTICLE
BULL/BEAR MARKET
Comerica May Undergo Relief Rally
07/25/08 08:31:45 AMby Chaitali Mohile
Comerica is in an intermediate downtrend, and the highly bearish indicators suggest a relief rally could be under way.
Position: N/A
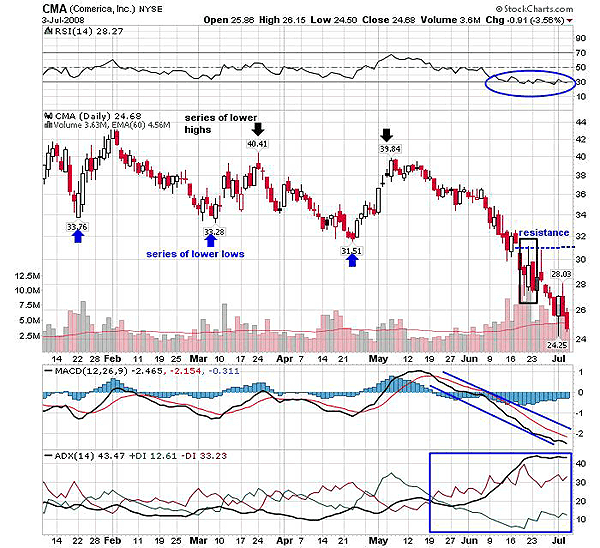
| The series of lower highs and lower lows was the first bearish indication for Comerica (CMA), as Figure 1 shows. The relative strength index (RSI) (14) failed to sustain above the golden level at 50, indicating poor bullish strength. By the time CMA reached the lowest low of 31.51, the RSI (14) moved to the oversold area at 30, adding bearish force. Since January 2008, the moving average convergence/divergence (MACD) (12,26,9) was unable to move above the zero line. These shaky moves affected the price rally. In May 2008, the bearish crossover drifted the indicator into negative territory, indicating a poor bullish hold. In addition, the average directional movement index (ADX) (14) indicates a poor trend in Figure 1. This entire scenario dragged the stock below the crucial support of 31.51. On these bearish notes, CMA tumbled to much lower levels, showing no signs of recovery. |

|
| FIGURE 1: THE BLACK BOX HAS THREE CANDLES, DAILY. The first small red candle is engulfed by the second big bullish (white) candle, forming a bullish engulfing pattern. |
| Graphic provided by: StockCharts.com. |
| |
| In Figure 1, the black box has three candles. The first small red candle is engulfed by the second big bullish (white) candle, forming a bullish engulfing pattern. The second candle closed much below the day's high at 31 and therefore formed a long upper shadow. For any rally from the lower levels, 31 will be the potential resistance. In addition, the formation of the upper shadow indicates that the bulls lack confidence to trade near the high. The third candle in the same marked box reconfirmed this weakness as the red candle completely covered the prior bullish candle (second candle). The stock retested the resistance of 31 and then plunged to the 24.50 level, losing approximately six points. |
| The RSI (14) has established the support at the 30 level instead of moving deeper in the oversold area. Here, the possibility of positive divergence arises as the price has moved to new lows. Since the RSI can remain in the oversold or overbought areas for a longer period, we cannot judge the exact period for the pullback rally. The MACD (12,26,9) has moved deeply into negative territory, and the gap between the trigger line and MACD is wide. This means the indicator is negative. According to ADX (14), the downtrend is overheated. Meanwhile, the low at 24.25 made by the spike can act at the strongest support. If CMA establishes support at 24.25, then a relief rally can be expected with the target of a previous resistance at 31. |

|
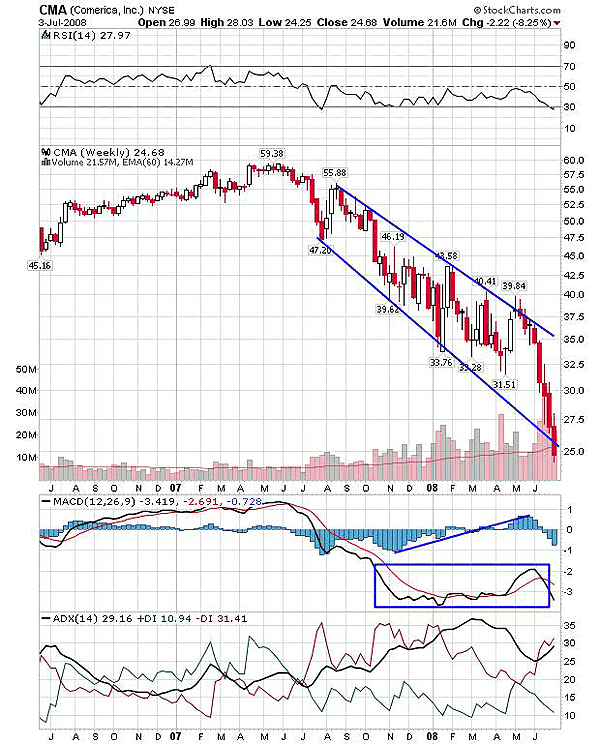
| FIGURE 2: CMA, WEEKLY. CMA was moderately in an uptrend in 2006–07. |
| Graphic provided by: StockCharts.com. |
| |
| According to Figure 2, CMA was in a moderate uptrend in 2006-07, with the RSI (14) rallying within the bullish area of 50-70. The heavy buying pressure pulled up the stock to the 60 level. The MACD (12,26,9) moved steadily in positive territory for a year. The stock rallied just 15 points in a year, indicating the slow growth in an upward direction and lack of bullish pressure in the rally. The RSI (14) that was comfortable within the range of 50-70 earlier suddenly slipped below the golden level as the price hit the high at 60. This negative divergence boosted the bears waiting on sidelines and the price began its downward trip. The MACD (12,26,9) declined from positive to negative territory, indicating weakness in the rally. And the ADX (14) surged from the 20 level, with an increase in selling pressure indicated by the negative directional index ( -DI). Thus, with the developing downtrend and increasing negativity, the stock drifted to new lows gradually. |
| The downward sloping channel shows the intensity of the bearish flow. And the indicators in Figure 2 suggest more downside rally in the near future. The RSI (14) has marginally touched the oversold level, and the MACD (12,26,9) shows no signs of bullish crossover that can bring back the bullish sentiments. And the ADX (14) at 29 indicate a developing downtrend. Apart from these bearish signals, the lower trendline of the channel has been breached by the recent closing for the week. So the weekly chart suggests that CMA is in an intermediate downtrend. Thus, in this intermediate downtrend, CMA can undergo a relief rally with the target of 31. |
Active trader in the Indian stock markets since 2003 and a full-time writer. Trading is largely based upon technical analysis.
| Company: | Independent |
| Address: | C1/3 Parth Indraprasth Towers. Vastrapur |
| Ahmedabad, Guj 380015 | |
| E-mail address: | chaitalimohile@yahoo.co.in |
Traders' Resource Links | |
| Independent has not added any product or service information to TRADERS' RESOURCE. | |
Click here for more information about our publications!
PRINT THIS ARTICLE

Request Information From Our Sponsors
- VectorVest, Inc.
- Executive Premier Workshop
- One-Day Options Course
- OptionsPro
- Retirement Income Workshop
- Sure-Fire Trading Systems (VectorVest, Inc.)
- Trading as a Business Workshop
- VectorVest 7 EOD
- VectorVest 7 RealTime/IntraDay
- VectorVest AutoTester
- VectorVest Educational Services
- VectorVest OnLine
- VectorVest Options Analyzer
- VectorVest ProGraphics v6.0
- VectorVest ProTrader 7
- VectorVest RealTime Derby Tool
- VectorVest Simulator
- VectorVest Variator
- VectorVest Watchdog
- StockCharts.com, Inc.
- Candle Patterns
- Candlestick Charting Explained
- Intermarket Technical Analysis
- John Murphy on Chart Analysis
- John Murphy's Chart Pattern Recognition
- John Murphy's Market Message
- MurphyExplainsMarketAnalysis-Intermarket Analysis
- MurphyExplainsMarketAnalysis-Visual Analysis
- StockCharts.com
- Technical Analysis of the Financial Markets
- The Visual Investor
