HOT TOPICS LIST
- MACD
- Fibonacci
- RSI
- Gann
- ADXR
- Stochastics
- Volume
- Triangles
- Futures
- Cycles
- Volatility
- ZIGZAG
- MESA
- Retracement
- Aroon
INDICATORS LIST
LIST OF TOPICS
PRINT THIS ARTICLE
by Arthur Hill
Despite an impressive surge over the last two weeks, Bank of America remains in a downtrend overall with resistance close at hand.
Position: Hold
Arthur Hill
Arthur Hill is currently editor of TDTrader.com, a website specializing in trading strategies, sector/industry specific breadth stats and overall technical analysis. He passed the Society of Technical Analysts (STA London) diploma exam with distinction is a Certified Financial Technician (CFTe). Prior to TD Trader, he was the Chief Technical Analyst for Stockcharts.com and the main contributor to the ChartSchool.
PRINT THIS ARTICLE
RETRACEMENT
Bank of America Charges To Resistance
07/23/08 09:11:06 AMby Arthur Hill
Despite an impressive surge over the last two weeks, Bank of America remains in a downtrend overall with resistance close at hand.
Position: Hold
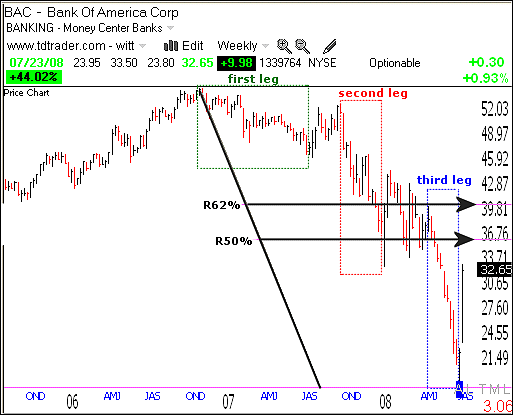
| Figure 1 shows weekly bars and devastating decline. Bank of America (BAC) declined from the mid-50s to the low 20s over the last two years. The decline can even be broken into three legs. The first leg was relatively tame and did not hint at trouble. The decline accelerated in the second leg and the third leg marked a freefall. This freefall signaled a capitulation and sparked a sharp oversold bounce over the last two weeks. |

|
| FIGURE 1: BAC, WEEKLY. Bank of America declined from the mid-50s to the low 20s over the last two years — a troubling decline. |
| Graphic provided by: TeleChart2007. |
| |
| Two key retracements are shown. After an extended decline, the stock became way oversold and ripe for an oversold bounce. A typical bounce would retrace between 50% and 62% of the prior decline. Note that I am marking retracements of the entire decline. A 50%–62% retracement of this big decline would call for a countertrend rally to the 36–40 area. |
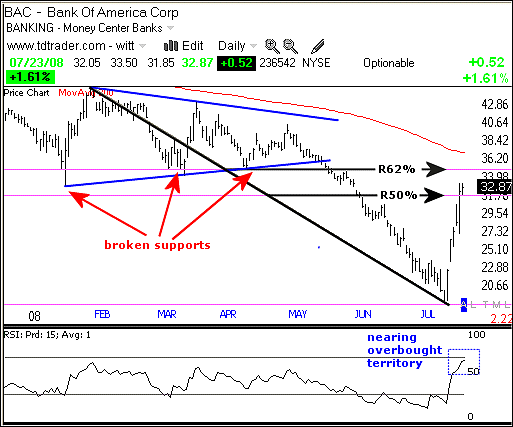
| A rally back to the 36–40 area would allow for another 10–20% gain from current levels. However, this may be too generous. Figure 2 shows daily bars with the same retracements. A 50%–62% retracement of the February–June decline would call for a rally back to the 32–34 area, which is where BAC is now. There is also resistance in this area from broken supports, which turn into resistance. The falling 200-day moving average (red line) will also enter this zone in the next week or two. |

|
| FIGURE 2: BAC, DAILY. A 50%–62% retracement of the February–June decline would call for a rally back to the 32–34 area, which is where BAC is as of now. |
| Graphic provided by: TeleChart2007. |
| |
| In addition to resistance and key retracements around 32–34, 15-day relative strength index (RSI) is almost in overbought territory. The indicator moved from oversold to overbought in just a few weeks. This attests to the sharpness of the rally. Even though the rally looks strong, resistance is near and a consolidation or pullback is likely in the coming days or weeks. |
Arthur Hill is currently editor of TDTrader.com, a website specializing in trading strategies, sector/industry specific breadth stats and overall technical analysis. He passed the Society of Technical Analysts (STA London) diploma exam with distinction is a Certified Financial Technician (CFTe). Prior to TD Trader, he was the Chief Technical Analyst for Stockcharts.com and the main contributor to the ChartSchool.
| Title: | Editor |
| Company: | TDTrader.com |
| Address: | Willem Geetsstraat 17 |
| Mechelen, B2800 | |
| Phone # for sales: | 3215345465 |
| Website: | www.tdtrader.com |
| E-mail address: | arthurh@tdtrader.com |
Traders' Resource Links | |
| TDTrader.com has not added any product or service information to TRADERS' RESOURCE. | |
Click here for more information about our publications!
Comments
Date: 07/23/08Rank: 3Comment:

Request Information From Our Sponsors
- StockCharts.com, Inc.
- Candle Patterns
- Candlestick Charting Explained
- Intermarket Technical Analysis
- John Murphy on Chart Analysis
- John Murphy's Chart Pattern Recognition
- John Murphy's Market Message
- MurphyExplainsMarketAnalysis-Intermarket Analysis
- MurphyExplainsMarketAnalysis-Visual Analysis
- StockCharts.com
- Technical Analysis of the Financial Markets
- The Visual Investor
- VectorVest, Inc.
- Executive Premier Workshop
- One-Day Options Course
- OptionsPro
- Retirement Income Workshop
- Sure-Fire Trading Systems (VectorVest, Inc.)
- Trading as a Business Workshop
- VectorVest 7 EOD
- VectorVest 7 RealTime/IntraDay
- VectorVest AutoTester
- VectorVest Educational Services
- VectorVest OnLine
- VectorVest Options Analyzer
- VectorVest ProGraphics v6.0
- VectorVest ProTrader 7
- VectorVest RealTime Derby Tool
- VectorVest Simulator
- VectorVest Variator
- VectorVest Watchdog
