HOT TOPICS LIST
- MACD
- Fibonacci
- RSI
- Gann
- ADXR
- Stochastics
- Volume
- Triangles
- Futures
- Cycles
- Volatility
- ZIGZAG
- MESA
- Retracement
- Aroon
INDICATORS LIST
LIST OF TOPICS
PRINT THIS ARTICLE
by Alan R. Northam
Apple has been in a bull market since 2003, but it now appears that this bull market ended at the end of 2007, and Apple could sell off to as low as $80 per share.
Position: N/A
Alan R. Northam
Alan Northam lives in the Dallas, Texas area and as an electronic engineer gave him an analytical mind from which he has developed a thorough knowledge of stock market technical analysis. His abilities to analyze the future direction of the stock market has allowed him to successfully trade of his own portfolio over the last 30 years. Mr. Northam is now retired and trading the stock market full time. You can reach him at inquiry@tradersclassroom.com or by visiting his website at http://www.tradersclassroom.com. You can also follow him on Twitter @TradersClassrm.
PRINT THIS ARTICLE
ELLIOTT WAVE
Apple Selloff Under Way
07/23/08 10:06:35 AMby Alan R. Northam
Apple has been in a bull market since 2003, but it now appears that this bull market ended at the end of 2007, and Apple could sell off to as low as $80 per share.
Position: N/A
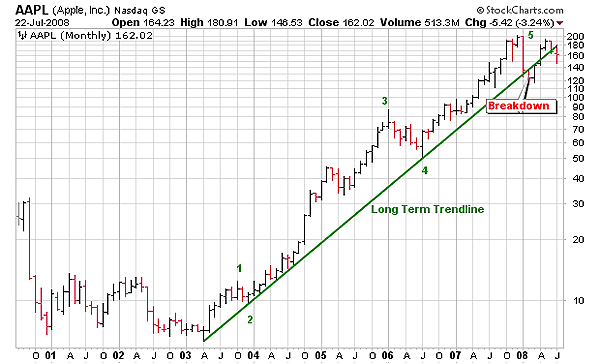
| In Figure 1, you'll see the monthly price chart of AAPL over the last eight years. As you can see, AAPL has been in a bull market trend since 2003. During this period, AAPL has traced out five nonoverlapping waves. According to the Elliott wave rules, five nonoverlapping rules in which wave 3 is not the shortest satisfies the rules for a completed impulse wave. Elliott wave theory further states that after the completion of an impulse wave, the market will correct the impulse in an ABC zigzag market correction. A zigzag market correction is one where the market will sell off for a certain period, forming the A wave, then bounce back upward for a short period, forming the B wave, and will then sell off again to form the final C wave. Further, Elliott theory states that waves A and C will be made up of five subwaves. To view these subwaves, we must look at a small time chart such as the daily price chart. Figure 1 also shows that AAPL has broken down below the upward sloping long-term trendline. This breakdown signals the completion of the long-term upward trend. |

|
| FIGURE 1: AAPL, MONTHLY. The monthly price chart of AAPL showing the Elliott wave count and the long-term trendline. This figure also shows the breakdown below the long-term trendline, signaling the end of the long-term upward trend from 2003. |
| Graphic provided by: StockCharts.com. |
| |
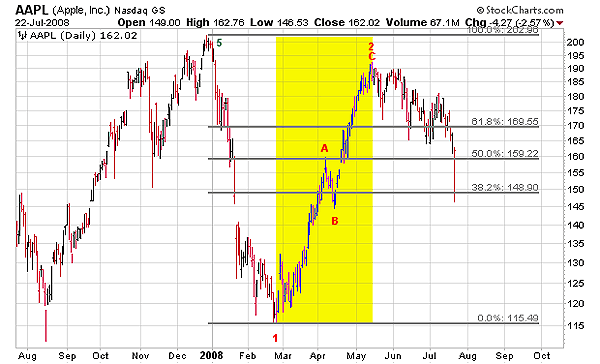
| Figure 2 is that of the daily price chart over the last 12 months. This price chart shows the market top at the end of 2007 and wave 1 down and wave 2 up. Wave 1 down and wave 2 up are the first two subwaves of wave A down. Wave 2s are normally very deep retracements and are formed as ABC zigzag waves. As you can see, wave 2 satisfies these Elliott rules and guidelines. Further, you will see that from the completion of wave 2 in early May, AAPL has been trading lower. This selloff from early May is the beginning of wave 3 of wave A with waves 4 and 5 yet to be completed to complete wave A. Upon completion of wave A, a B wave bounce will occur followed by a final wave C down. This whole process can take from a third to two-thirds of the length of time of the previous major market rally. Since the previous major market rally started in 2003 and ran for alost five years, we can expect AAPL to continue lower for the next two to three years. The next question is, how far will AAPL fall? This question is answered in Figure 3. |

|
| FIGURE 2: AAPL, DAILY. The daily price chart of AAPL over the last 12 months. This chart shows the market top in late December 2007 and shows that waves 1 and 2 are complete. This chart also shows the Fibonacci retracement levels and illustrates that wave 2 was a very deep retracement of the complete selloff from the end of 2007. |
| Graphic provided by: StockCharts.com. |
| |
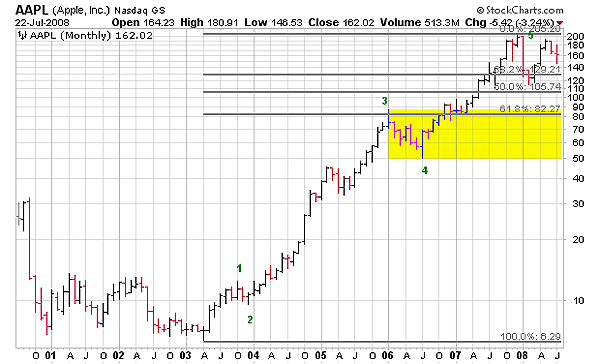
| In Figure 3 I have again shown the monthly chart of AAPL, only this time I have shown the Fibonacci retracement levels. I have also highlighted the area between the previous third and fourth waves. According to the Elliott wave guidelines, market corrections normally retrace from 38% to as low as 62% of the price gained during the previous rally. Elliott also states that after a five-wave impulse, the market will typically retrace to the area of the previous third and fourth waves (see yellow highlighted area). The area of the previous third and fourth waves also encompasses the 61.8% Fibonacci retracement price level so $80 looks like a likely price target for the retracement to end. I have rounded down the 61.8% retracement price of $82.27, as markets like round numbers to end retracements at. Note that once waves A and B are complete, we can get a better estimate as to when to expect the market correction in AAPL to be over. Further, note that once waves 1 through 4 of wave C is complete, we can get an even better estimate as to when the market correcion will be finished. |

|
| FIGURE 3: AAPL, MONTHLY. The monthly price chart shows the Fibonacci retracement price levels and highlights the area between the previous third and fourth waves. This chart shows the price for APPL after the market correction is complete to be in the highlighted area. A good price target for AAPL upon completion of the market correction is expected to be around $80 per share. |
| Graphic provided by: StockCharts.com. |
| |
| In conclusion, AAPL has now completed a five-wave impulse in the upward direction. Upon completion of an impulse wave pattern, the rules of the Elliott wave principles state that the market will enter into a correction to correct the complete advance of the impulse wave. Elliott also states that a market correction following a completed impulse wave normally retraces into the area of the previous third and fourth waves. It now appears that this market correction is now under way and we can expect this correction to last from one to two years and should draw APPL down to an estimated price target of $80 per share. |
Alan Northam lives in the Dallas, Texas area and as an electronic engineer gave him an analytical mind from which he has developed a thorough knowledge of stock market technical analysis. His abilities to analyze the future direction of the stock market has allowed him to successfully trade of his own portfolio over the last 30 years. Mr. Northam is now retired and trading the stock market full time. You can reach him at inquiry@tradersclassroom.com or by visiting his website at http://www.tradersclassroom.com. You can also follow him on Twitter @TradersClassrm.
| Garland, Tx | |
| Website: | www.tradersclassroom.com |
| E-mail address: | inquiry@tradersclassroom.com |
Click here for more information about our publications!
Comments
Date: 07/23/08Rank: 4Comment:

Request Information From Our Sponsors
- StockCharts.com, Inc.
- Candle Patterns
- Candlestick Charting Explained
- Intermarket Technical Analysis
- John Murphy on Chart Analysis
- John Murphy's Chart Pattern Recognition
- John Murphy's Market Message
- MurphyExplainsMarketAnalysis-Intermarket Analysis
- MurphyExplainsMarketAnalysis-Visual Analysis
- StockCharts.com
- Technical Analysis of the Financial Markets
- The Visual Investor
- VectorVest, Inc.
- Executive Premier Workshop
- One-Day Options Course
- OptionsPro
- Retirement Income Workshop
- Sure-Fire Trading Systems (VectorVest, Inc.)
- Trading as a Business Workshop
- VectorVest 7 EOD
- VectorVest 7 RealTime/IntraDay
- VectorVest AutoTester
- VectorVest Educational Services
- VectorVest OnLine
- VectorVest Options Analyzer
- VectorVest ProGraphics v6.0
- VectorVest ProTrader 7
- VectorVest RealTime Derby Tool
- VectorVest Simulator
- VectorVest Variator
- VectorVest Watchdog
