HOT TOPICS LIST
- MACD
- Fibonacci
- RSI
- Gann
- ADXR
- Stochastics
- Volume
- Triangles
- Futures
- Cycles
- Volatility
- ZIGZAG
- MESA
- Retracement
- Aroon
INDICATORS LIST
LIST OF TOPICS
PRINT THIS ARTICLE
by Alan R. Northam
USO has been in an uptrend since 1999, but it now looks like the upward trend is over and a sizable correction in oil is at hand, one that could drop the price of oil to as low as $53 per barrel.
Position: N/A
Alan R. Northam
Alan Northam lives in the Dallas, Texas area and as an electronic engineer gave him an analytical mind from which he has developed a thorough knowledge of stock market technical analysis. His abilities to analyze the future direction of the stock market has allowed him to successfully trade of his own portfolio over the last 30 years. Mr. Northam is now retired and trading the stock market full time. You can reach him at inquiry@tradersclassroom.com or by visiting his website at http://www.tradersclassroom.com. You can also follow him on Twitter @TradersClassrm.
PRINT THIS ARTICLE
TREND-CHANNEL
Is The Oil Uptrend Over?
07/23/08 08:44:34 AMby Alan R. Northam
USO has been in an uptrend since 1999, but it now looks like the upward trend is over and a sizable correction in oil is at hand, one that could drop the price of oil to as low as $53 per barrel.
Position: N/A
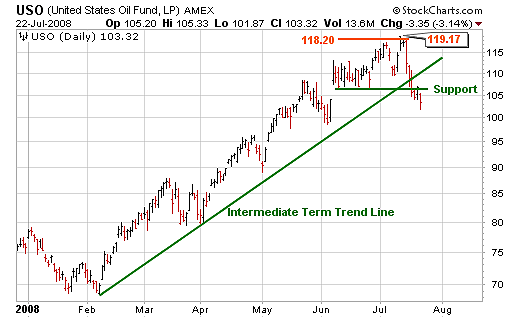
| On June 2, I wrote an article entitled "Is USO Ready To Turn Lower?" I pointed out that the next target price for oil to end the rally was $118.20 per barrel. I encourage rereading this article for details as to how I arrived at this target price. Since that time, USO climbed higher and hit this price target on July 11. On that day, USO made a market high price of $119.17 per barrel and has been trading lower since (see Figure 1). |
| In Figure 1, I show the daily price chart of the current intermediate-term rally that began in February 2008. On this chart I have shown an upward trending intermediate-term trendline drawn off the first short-term rally reaction low in early April. As you can see, there has been three other short-term rallies since with the reaction of the first two short-term rallies holding above this intermediate-term trendline. However, the final short-term rally reaction failed to hold above this intermediate-term trendline and has broken down below it. This breakdown signals the end of the intermediate rally that began in February. I have also shown a support line drawn off the mid- to late June price minimums. Over the course of the last few days of trading, USO has also broken below support. Once price breaks down below a support line, that line of support changes its function and becomes a new line of resistance. Therefore, any rally attempts should find resistance at this new resistance line. |

|
| FIGURE 1: USO, DAILY. Here's a daily price chart of USO showing an intermediate-term trendline, support level, and price target. |
| Graphic provided by: StockCharts.com. |
| |
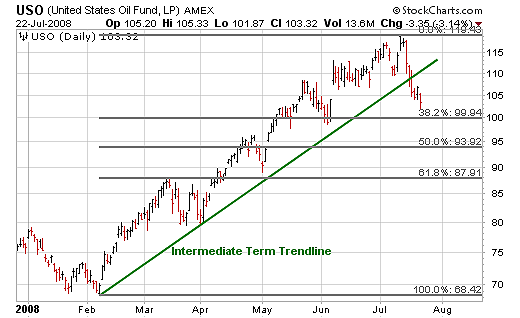
| In Figure 2, I have shown the daily price chart from the beginning of the current intermediate rally. On this chart I have plotted the Fibonacci retracement levels of 38.2%, 50%, and 61.8%. These Fibonacci retracement levels are typical price levels of market corrections. The breakdown below the intermediate-term trendline has signaled the end of the intermediate rally that began in February and has ushered in a market correction that should see oil sell off to one of these three retracement levels. As you can see from Figure 2, USO is now approaching its first retracement level of 38.2%. Typically, market corrections form in a zigzag fashion. In other words, the market will trade down for several days, then move up for a few days, and then trade back down for several more. I do not see that a zigzag pattern has developed since the selloff from the July price peak began. As such, I would expect USO to continue lower to at least the 50% retracement level before launching a new market rally. |

|
| FIGURE 2: USO, DAILY. Here's a daily price chart of USO showing Fibonacci retracement price levels. |
| Graphic provided by: StockCharts.com. |
| |
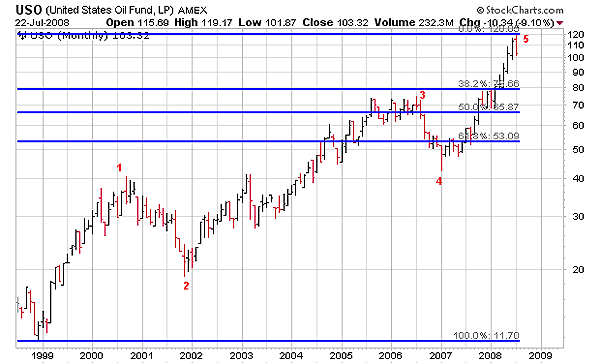
| However, I believe that oil could fall much further. In Figure 3 I have shown the monthly price chart for USO from the beginning of the current bull market rally in 1999. In this chart I have shown that USO has completed five nonoverlapping waves. According to the Elliott wave rules, USO has now completed a long-term uptrend. Elliott also calls for an ABC zigzag market correction following the completion of a five-wave move up. There is one exception to the rule that I must divulge at this point. Oil is a commodity, and waves 5s in commodities can extend. So once the current market correction is over, that corrects the just-completed intermediate-term rally (see Figures 1 and 2) and then wave 5 could extend higher. However, if wave 5 does not extend, then USO should continue to correct over the months ahead in a downward zigzag fashion and correct to one of the Fibonacci retracement levels shown here in Figure 3. |

|
| FIGURE 3: USO, MONTHLY. Here's a monthly price chart of USO showing the Elliott wave count. This chart shows five nonoverlapping waves that satisfy the Elliott wave rules, completing the bull market rally from 1999. |
| Graphic provided by: StockCharts.com. |
| |
| In conclusion, USO has completed five waves up and should now be entering into a downward market correction that could see oil fall to as much as $53 per barrel. Further, there exists a possibility that wave 5 could extend higher before any sizable market correction begins. However, when we look at the fifth wave in Figure 1, I have shown that the intermediate-term trendline, composing wave 5, has been broken, signaling the completion of wave 5. I believe that there is a higher probability for a significant selloff in oil than for the price of oil to continue higher. |
Alan Northam lives in the Dallas, Texas area and as an electronic engineer gave him an analytical mind from which he has developed a thorough knowledge of stock market technical analysis. His abilities to analyze the future direction of the stock market has allowed him to successfully trade of his own portfolio over the last 30 years. Mr. Northam is now retired and trading the stock market full time. You can reach him at inquiry@tradersclassroom.com or by visiting his website at http://www.tradersclassroom.com. You can also follow him on Twitter @TradersClassrm.
| Garland, Tx | |
| Website: | www.tradersclassroom.com |
| E-mail address: | inquiry@tradersclassroom.com |
Click here for more information about our publications!
Comments
Date: 07/23/08Rank: 5Comment:
Date: 07/29/08Rank: 5Comment:

Request Information From Our Sponsors
- StockCharts.com, Inc.
- Candle Patterns
- Candlestick Charting Explained
- Intermarket Technical Analysis
- John Murphy on Chart Analysis
- John Murphy's Chart Pattern Recognition
- John Murphy's Market Message
- MurphyExplainsMarketAnalysis-Intermarket Analysis
- MurphyExplainsMarketAnalysis-Visual Analysis
- StockCharts.com
- Technical Analysis of the Financial Markets
- The Visual Investor
- VectorVest, Inc.
- Executive Premier Workshop
- One-Day Options Course
- OptionsPro
- Retirement Income Workshop
- Sure-Fire Trading Systems (VectorVest, Inc.)
- Trading as a Business Workshop
- VectorVest 7 EOD
- VectorVest 7 RealTime/IntraDay
- VectorVest AutoTester
- VectorVest Educational Services
- VectorVest OnLine
- VectorVest Options Analyzer
- VectorVest ProGraphics v6.0
- VectorVest ProTrader 7
- VectorVest RealTime Derby Tool
- VectorVest Simulator
- VectorVest Variator
- VectorVest Watchdog
