

HOT TOPICS LIST
- MACD
- Fibonacci
- RSI
- Gann
- ADXR
- Stochastics
- Volume
- Triangles
- Futures
- Cycles
- Volatility
- ZIGZAG
- MESA
- Retracement
- Aroon
INDICATORS LIST
LIST OF TOPICS
PRINT THIS ARTICLE
by Chaitali Mohile
Deep below the neckline resistance, NSM formed a bullish engulfing pattern. The rally currently stands closer to same resistance. Will the stock break out?
Position: N/A
Chaitali Mohile
Active trader in the Indian stock markets since 2003 and a full-time writer. Trading is largely based upon technical analysis.
PRINT THIS ARTICLE
REVERSAL
Will NSM Break Out?
07/22/08 08:38:23 AMby Chaitali Mohile
Deep below the neckline resistance, NSM formed a bullish engulfing pattern. The rally currently stands closer to same resistance. Will the stock break out?
Position: N/A
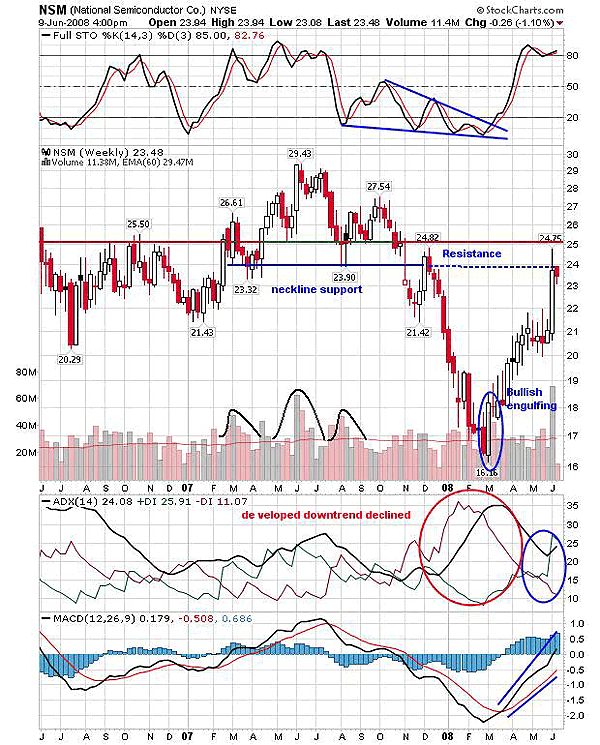
| In 2007, National Semiconductor Co. (NSM) formed a head & shoulders top reversal pattern with a neckline support at 24. The volume pattern also confirms the price reversal. Volume is highest as left shoulder is formed. In fact, the volume is often expanding as more and more buyers try to ride the rally. As the right shoulder is formed, the reversal pattern becomes clearer, resulting in lowest volume. And near the head, the volume falls somewhere in between the strength of left shoulder and the weakness of right shoulder. During the neckline breakout, the volume increases as the reversal pattern gets completed. In Figure 1, we can see a similar volume pattern (in black) and thus reconfirm the price reversal. |
| On the breakout, the price moved back to retest the newly formed neckline resistance. This was the best opportunity for the new traders to board the downside rally. NSM then plunged to 16.16, which is lower than the breakout target of 18.57. To compute the targeted price, measure the distance between head (highest level) and the neckline. Then subtract this number from the neckline breakout. According to Figure 1, the distance is 29.43 - 24 = 5.43; subtracting 5.43 from 24 (neckline), we get 18.57 as our target on a head & shoulders breakout (24 - 5.43 = 18.57). The stochastic (14,3,3) saw the series of lower highs and lower lows, and reached a highly oversold area below the 20 level, indicating no further downside. Meanwhile, the average directional movement index (ADX) (14) developed a strong downtrend and the moving average convergence/divergence (MACD) (12,26,9) plunged to negative territory. Thus, all three indicators are highly bearish, indicating a fresh rally. |
|
| FIGURE 1: NSM, WEEKLY. The rally followed by the bullish engulfing pattern at the 16.16 level has reached the first resistance. The support–resistance line in green and red shows the second resistance at the 25 level. |
| Graphic provided by: StockCharts.com. |
| |
| Later, as the bullish engulfing pattern was formed at the lowest level of 16.16, the highly bearish indicators turned positive. The well-developed downtrend started declining from 35 levels. This indicated that the bears are likely to lose their hold and a bullish rally is about to begin. The bullish rally that started in March 2008 was supported by high volume. However, the rally had two strong resistances — first, the neckline at the 24 level (extended line), and second, the highs made by the spikes at the 25 level (marked by the support–resistance line in Figure 1). Currently, NSM is near the first resistance line at 24. Though the indicators are bullish to carry the rally ahead, resistance is much stronger to drag down the price. So any major breakout move is not visible right now. |
|
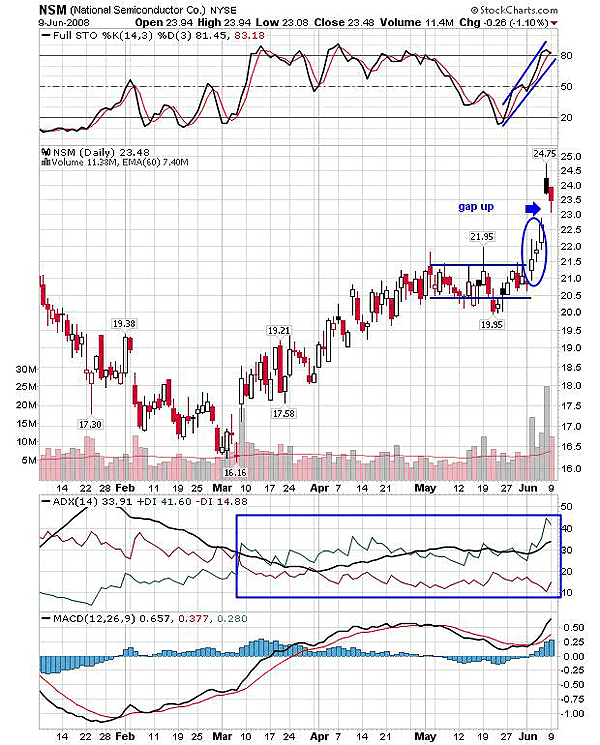
| FIGURE 2: NSM, DAILY. The ADX (14) shows NSM in an uptrend consistently for the last four months. The buying pressure indicated by the positve directional index (+DI) is likely to decline, but the trend remains bullish. |
| Graphic provided by: StockCharts.com. |
| |
| The prolonged rally from the 16.16 level consolidated in the range of 21.5–20.5, forming the bullish flag & pennant continuation pattern. This pattern breaks in the direction of an existing uptrend. In Figure 2, the price broke in the upward direction, rallying higher. But the three white candlesticks that occurred had long upper and lower shadows, indicating the weakness to hold the day's highs and lows as well. Due to declining stochastic (14,3,3), the gap up failed to attract more buyers, and thus, NSM immediately moved down to fill the gap. In Figure 1, the ADX (14) shows a developed uptrend and the MACD (12,26,9) is well in positive territory. However, these two bullish indicators can be easily ignored by the strong bearish notes. |
| The breakout may not surge above resistance, and thus, the successful breakout rally seems uncertain. |
Active trader in the Indian stock markets since 2003 and a full-time writer. Trading is largely based upon technical analysis.
| Company: | Independent |
| Address: | C1/3 Parth Indraprasth Towers. Vastrapur |
| Ahmedabad, Guj 380015 | |
| E-mail address: | chaitalimohile@yahoo.co.in |
Traders' Resource Links | |
| Independent has not added any product or service information to TRADERS' RESOURCE. | |
Click here for more information about our publications!
Comments

Request Information From Our Sponsors
- StockCharts.com, Inc.
- Candle Patterns
- Candlestick Charting Explained
- Intermarket Technical Analysis
- John Murphy on Chart Analysis
- John Murphy's Chart Pattern Recognition
- John Murphy's Market Message
- MurphyExplainsMarketAnalysis-Intermarket Analysis
- MurphyExplainsMarketAnalysis-Visual Analysis
- StockCharts.com
- Technical Analysis of the Financial Markets
- The Visual Investor
- VectorVest, Inc.
- Executive Premier Workshop
- One-Day Options Course
- OptionsPro
- Retirement Income Workshop
- Sure-Fire Trading Systems (VectorVest, Inc.)
- Trading as a Business Workshop
- VectorVest 7 EOD
- VectorVest 7 RealTime/IntraDay
- VectorVest AutoTester
- VectorVest Educational Services
- VectorVest OnLine
- VectorVest Options Analyzer
- VectorVest ProGraphics v6.0
- VectorVest ProTrader 7
- VectorVest RealTime Derby Tool
- VectorVest Simulator
- VectorVest Variator
- VectorVest Watchdog