HOT TOPICS LIST
- MACD
- Fibonacci
- RSI
- Gann
- ADXR
- Stochastics
- Volume
- Triangles
- Futures
- Cycles
- Volatility
- ZIGZAG
- MESA
- Retracement
- Aroon
INDICATORS LIST
LIST OF TOPICS
PRINT THIS ARTICLE
by Arthur Hill
Despite holding up well over the last two to three months, Wal-Mart sports a potential head & shoulders pattern that could mark a distribution phase.
Position: Sell
Arthur Hill
Arthur Hill is currently editor of TDTrader.com, a website specializing in trading strategies, sector/industry specific breadth stats and overall technical analysis. He passed the Society of Technical Analysts (STA London) diploma exam with distinction is a Certified Financial Technician (CFTe). Prior to TD Trader, he was the Chief Technical Analyst for Stockcharts.com and the main contributor to the ChartSchool.
PRINT THIS ARTICLE
ON BALANCE VOLUME
Wal-Mart Under Distribution?
07/22/08 11:00:15 AMby Arthur Hill
Despite holding up well over the last two to three months, Wal-Mart sports a potential head & shoulders pattern that could mark a distribution phase.
Position: Sell
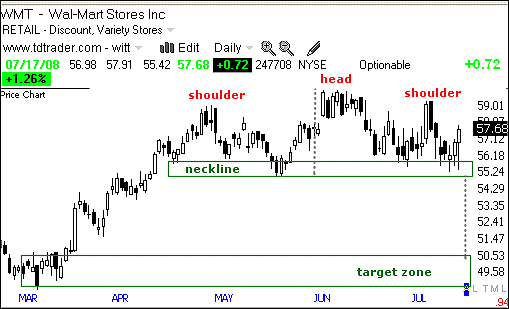
| Figure 1 shows daily candlesticks over the last five months. Wal-Mart (WMT) moved to the upper 50s in late April and then consolidated. With a high in early June and lower highs on either side, a head & shoulders pattern is taking shape. The May-July lows mark neckline support around 55, and a break below this level would confirm the pattern. Once confirmed, the downside target would be the next support zone around 50. |

|
| FIGURE 1: WMT, DAILY. Wal-Mart moved to the upper 50s in late April and then consolidated. |
| Graphic provided by: TeleChart2007. |
| |
| Some signs of selling pressure are starting to appear. The stock gapped higher in early June, but failed to hold this gap and filled it two weeks later. After bouncing off support, the stock formed a dark cloud pattern to mark the high of the right shoulder. WMT moved lower after this bearish candlestick reversal, but got a bounce off support recently. This bounce reinforces support and it would take a move below the May low to fully confirm this head & shoulders pattern. |
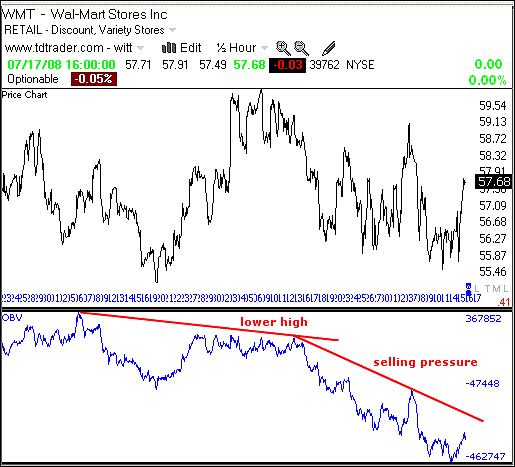
| I would like to know what happened within the head & shoulders pattern. Did distribution occur, or did buyers keep up the pressure? For this answer, I decided to look at the 30-minute chart with the on-balance volume (OBV)(see Figure 2). The entire head & shoulders pattern is captured by this chart, and OBV moved lower as the pattern formed. This tells me that volume on declines was stronger than volume on advances. |

|
| FIGURE 2: WMT, 30-MINUTE. Did distribution occur, or did buyers keep up the pressure? |
| Graphic provided by: TeleChart2007. |
| |
| While WMT hit a new high in early June, OBV formed a lower high. This shows less buying pressure on the new high. OBV moved sharply lower after the early June peak and broke to new lows. This is a clear sign of distribution. The head & shoulders pattern is a distribution pattern, and neckline support is the only thing standing in the way of confirmation. |
Arthur Hill is currently editor of TDTrader.com, a website specializing in trading strategies, sector/industry specific breadth stats and overall technical analysis. He passed the Society of Technical Analysts (STA London) diploma exam with distinction is a Certified Financial Technician (CFTe). Prior to TD Trader, he was the Chief Technical Analyst for Stockcharts.com and the main contributor to the ChartSchool.
| Title: | Editor |
| Company: | TDTrader.com |
| Address: | Willem Geetsstraat 17 |
| Mechelen, B2800 | |
| Phone # for sales: | 3215345465 |
| Website: | www.tdtrader.com |
| E-mail address: | arthurh@tdtrader.com |
Traders' Resource Links | |
| TDTrader.com has not added any product or service information to TRADERS' RESOURCE. | |
Click here for more information about our publications!
PRINT THIS ARTICLE

Request Information From Our Sponsors
- StockCharts.com, Inc.
- Candle Patterns
- Candlestick Charting Explained
- Intermarket Technical Analysis
- John Murphy on Chart Analysis
- John Murphy's Chart Pattern Recognition
- John Murphy's Market Message
- MurphyExplainsMarketAnalysis-Intermarket Analysis
- MurphyExplainsMarketAnalysis-Visual Analysis
- StockCharts.com
- Technical Analysis of the Financial Markets
- The Visual Investor
- VectorVest, Inc.
- Executive Premier Workshop
- One-Day Options Course
- OptionsPro
- Retirement Income Workshop
- Sure-Fire Trading Systems (VectorVest, Inc.)
- Trading as a Business Workshop
- VectorVest 7 EOD
- VectorVest 7 RealTime/IntraDay
- VectorVest AutoTester
- VectorVest Educational Services
- VectorVest OnLine
- VectorVest Options Analyzer
- VectorVest ProGraphics v6.0
- VectorVest ProTrader 7
- VectorVest RealTime Derby Tool
- VectorVest Simulator
- VectorVest Variator
- VectorVest Watchdog
