HOT TOPICS LIST
- MACD
- Fibonacci
- RSI
- Gann
- ADXR
- Stochastics
- Volume
- Triangles
- Futures
- Cycles
- Volatility
- ZIGZAG
- MESA
- Retracement
- Aroon
INDICATORS LIST
LIST OF TOPICS
PRINT THIS ARTICLE
by Mike Carr, CMT
IndyMac, Fannie Mae, and Freddie Mac have cost investors billions, but technicians should have been out of the stock or short these high-profile losers.
Position: Sell
Mike Carr, CMT
Mike Carr, CMT, is a member of the Market Technicians Association, and editor of the MTA's newsletter, Technically Speaking. He is also the author of "Smarter Investing in Any Economy: The Definitive Guide to Relative Strength Investing," and "Conquering the Divide: How to Use Economic Indicators to Catch Stock Market Trends."
PRINT THIS ARTICLE
MOVING AVERAGES
Technicals Can Help Traders Avoid Disaster
07/18/08 03:22:42 PMby Mike Carr, CMT
IndyMac, Fannie Mae, and Freddie Mac have cost investors billions, but technicians should have been out of the stock or short these high-profile losers.
Position: Sell
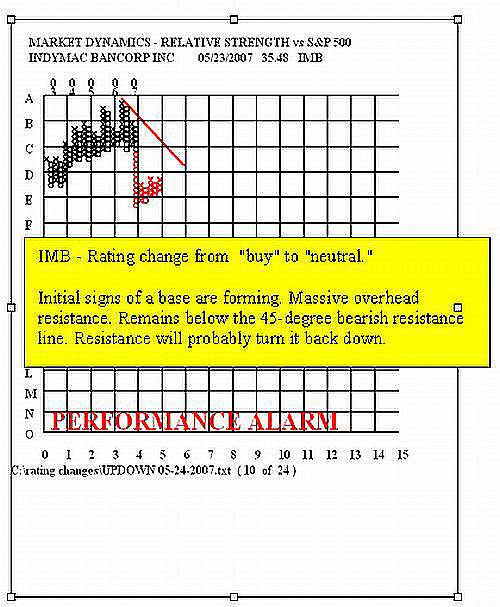
| By the time the Feds took over IndyMac (IMB), the stock had already fallen to 0.62. Amazingly to technicians, people were still long this stock. Fundamental analysts had rated it "neutral" in May 2007, with the price above 35. Relative strength was strongly bearish by that time (Figure 1). |

|
| FIGURE 1: IMB, P&F. The point & figure chart of relative strength in IndyMac was already negative by the time fundamental analysts turned neutral. |
| Graphic provided by: Market Dynamics. |
| |
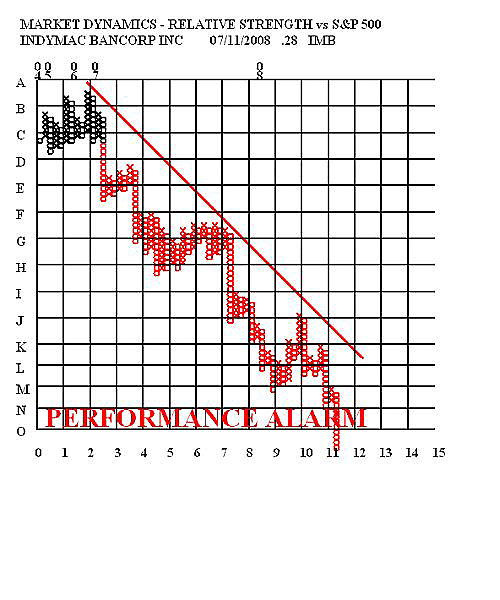
| Relative strength never recovered in IMB (Figure 2), and neither did price. This single technical indicator would have kept investors out of a bad stock, and alerted aggressive traders to a possible short. |

|
| FIGURE 2: IMB, RELATIVE STRENGTH. Relative strength in IMB never turned bullish after the analyst downgrade in May 2007. |
| Graphic provided by: Market Dynamics. |
| |
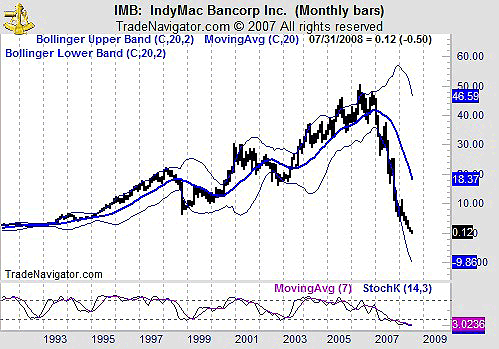
| The traditional price chart was also bearish for IMB (Figure 3). Prices have been below their 20-month moving average since the beginning of 2007. Stochastics traced out a negative divergence in 2006, indicating that the next move was likely lower. |

|
| FIGURE 3: IMB, MONTHLY. The monthly chart of IMB shows that bears have been in control for more than a year and a half. |
| Graphic provided by: Trade Navigator. |
| |
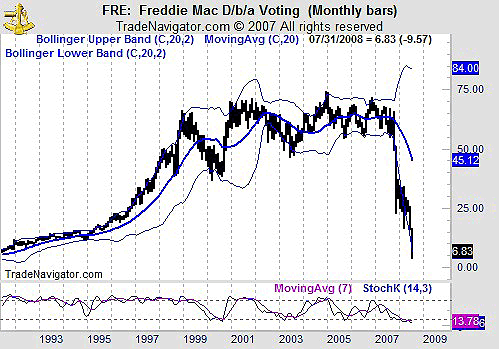
| Interestingly, Freddie Mac (FRE) was showing a similar pattern (Figure 4). The long-term moving average and stochastics both warned traders of lower prices. |

|
| FIGURE 4: FRE, MONTHLY. Freddie Mac formed a topping pattern over a six-year period before collapsing at the end of 2007. |
| Graphic provided by: Trade Navigator. |
| |
| Fannie Mae (FNM) looks exactly the same. Those looking to enter long positions should look at a monthly, or at least a weekly chart. Stocks with prices below their long-term moving average may still be bought, but tight stops should be used to avoid holding stocks that ultimately collapse. |
Mike Carr, CMT, is a member of the Market Technicians Association, and editor of the MTA's newsletter, Technically Speaking. He is also the author of "Smarter Investing in Any Economy: The Definitive Guide to Relative Strength Investing," and "Conquering the Divide: How to Use Economic Indicators to Catch Stock Market Trends."
| Website: | www.moneynews.com/blogs/MichaelCarr/id-73 |
| E-mail address: | marketstrategist@gmail.com |
Click here for more information about our publications!
Comments
Date: 07/22/08Rank: 5Comment:

Request Information From Our Sponsors
- VectorVest, Inc.
- Executive Premier Workshop
- One-Day Options Course
- OptionsPro
- Retirement Income Workshop
- Sure-Fire Trading Systems (VectorVest, Inc.)
- Trading as a Business Workshop
- VectorVest 7 EOD
- VectorVest 7 RealTime/IntraDay
- VectorVest AutoTester
- VectorVest Educational Services
- VectorVest OnLine
- VectorVest Options Analyzer
- VectorVest ProGraphics v6.0
- VectorVest ProTrader 7
- VectorVest RealTime Derby Tool
- VectorVest Simulator
- VectorVest Variator
- VectorVest Watchdog
- StockCharts.com, Inc.
- Candle Patterns
- Candlestick Charting Explained
- Intermarket Technical Analysis
- John Murphy on Chart Analysis
- John Murphy's Chart Pattern Recognition
- John Murphy's Market Message
- MurphyExplainsMarketAnalysis-Intermarket Analysis
- MurphyExplainsMarketAnalysis-Visual Analysis
- StockCharts.com
- Technical Analysis of the Financial Markets
- The Visual Investor
