HOT TOPICS LIST
- MACD
- Fibonacci
- RSI
- Gann
- ADXR
- Stochastics
- Volume
- Triangles
- Futures
- Cycles
- Volatility
- ZIGZAG
- MESA
- Retracement
- Aroon
INDICATORS LIST
LIST OF TOPICS
PRINT THIS ARTICLE
by Chaitali Mohile
French CAC 40 Index had a huge gap down followed by a bearish trading session. The gap down resistance may restrict the breakout.
Position: N/A
Chaitali Mohile
Active trader in the Indian stock markets since 2003 and a full-time writer. Trading is largely based upon technical analysis.
PRINT THIS ARTICLE
GAPS
French Index Under Bearish Pressure
07/28/08 12:08:45 PMby Chaitali Mohile
French CAC 40 Index had a huge gap down followed by a bearish trading session. The gap down resistance may restrict the breakout.
Position: N/A
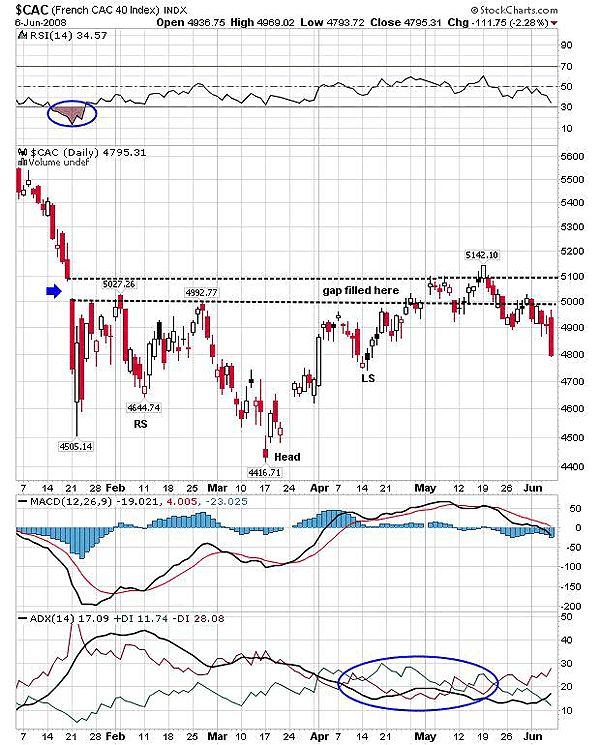
| The French Index ($CAC) had a bad trading session on January 21, 2008. $CAC opened with a huge gap down of 100 points, losing another 350 points by end of day. The relative strength index (RSI) (14) turned highly oversold and the moving average convergence/divergence (MACD) (12,26,9) rallied to negative territory. The average directional movement index (ADX) (14) reached overheated levels, and therefore, the trend declined gradually. A declining downtrend and highly oversold RSI (14) indicated the possibility of a pullback rally. But every upside swing had a strong resistance of gap-down levels. The technical methods to trade the gaps are either during the consolidation after the gap up/down movement or as the gap gets filled. The index moved back to the lower levels as the resistance at 5000 and 5100 (the gap) was tested. In Figure 1, we can see the resistance was challenged frequently. |
| These volatile moves formed an inverse head & shoulder pattern with neckline resistance at 5000. This is a bullish reversal pattern that initiates an upside rally on the breakout. The breakout is considered robust, as the pattern is a rare event and therefore is highly reliable (confirmation of the breakout is essential). The breakout target is measured as 5576 (4993 - 4417 = 576 + 5000 = 5576). The estimated level after the breakout is calculated by measuring the distance between the neckline and the lowest point of the head. This distance is added to the breakout level. As seen in Figure 1, the breakout rally filled the gap but later failed to move ahead of the 5100 resistance. The index consolidated within the range of 100 points (gap down) and thus the reversal pattern failed. This was the first bearish indication that extended the negative sentiments across the financial market. |

|
| FIGURE 1: $CAC, DAILY. The inverse head & shoulders breakout consolidated in a gap of 100 points. |
| Graphic provided by: StockCharts.com. |
| |
| Second, the gap was filled but the index could not surge above 5100; instead, it plunged below a newly formed neckline support at 5000. Therefore, two major technical supports were again converted to the resistance. On June 6, the index plummetted 111 points and may slide even further. The moving average convergence/divergence (MACD) (12,26,9) is about to enter negative territory. In addition, the relative strength index (RSI)(14) failed to establish the support at 50 and continued to descend toward the oversold levels. Therefore, the RSI (14) sliding below 30 would suggest further downside in the index. In addition, the ADX (14) at 17 shows increasing selling pressure and reducing buying pressure. |
| Thus, the weak indicators and breakout failure shows that the bearish pressure would increase gradually and continue ruling $CAC. The negative sentiments might pull down the index levels. |
Active trader in the Indian stock markets since 2003 and a full-time writer. Trading is largely based upon technical analysis.
| Company: | Independent |
| Address: | C1/3 Parth Indraprasth Towers. Vastrapur |
| Ahmedabad, Guj 380015 | |
| E-mail address: | chaitalimohile@yahoo.co.in |
Traders' Resource Links | |
| Independent has not added any product or service information to TRADERS' RESOURCE. | |
Click here for more information about our publications!
PRINT THIS ARTICLE

Request Information From Our Sponsors
- StockCharts.com, Inc.
- Candle Patterns
- Candlestick Charting Explained
- Intermarket Technical Analysis
- John Murphy on Chart Analysis
- John Murphy's Chart Pattern Recognition
- John Murphy's Market Message
- MurphyExplainsMarketAnalysis-Intermarket Analysis
- MurphyExplainsMarketAnalysis-Visual Analysis
- StockCharts.com
- Technical Analysis of the Financial Markets
- The Visual Investor
- VectorVest, Inc.
- Executive Premier Workshop
- One-Day Options Course
- OptionsPro
- Retirement Income Workshop
- Sure-Fire Trading Systems (VectorVest, Inc.)
- Trading as a Business Workshop
- VectorVest 7 EOD
- VectorVest 7 RealTime/IntraDay
- VectorVest AutoTester
- VectorVest Educational Services
- VectorVest OnLine
- VectorVest Options Analyzer
- VectorVest ProGraphics v6.0
- VectorVest ProTrader 7
- VectorVest RealTime Derby Tool
- VectorVest Simulator
- VectorVest Variator
- VectorVest Watchdog
