HOT TOPICS LIST
- MACD
- Fibonacci
- RSI
- Gann
- ADXR
- Stochastics
- Volume
- Triangles
- Futures
- Cycles
- Volatility
- ZIGZAG
- MESA
- Retracement
- Aroon
INDICATORS LIST
LIST OF TOPICS
PRINT THIS ARTICLE
by Chaitali Mohile
RGNC has moved up from the descending triangle. But is this reversal breakout robust enough to climb back up to the bullish levels?
Position: N/A
Chaitali Mohile
Active trader in the Indian stock markets since 2003 and a full-time writer. Trading is largely based upon technical analysis.
PRINT THIS ARTICLE
DESCENDING TRIANGLES
Can RGNC Become A Strong Bullish Stock?
07/29/08 11:11:22 AMby Chaitali Mohile
RGNC has moved up from the descending triangle. But is this reversal breakout robust enough to climb back up to the bullish levels?
Position: N/A
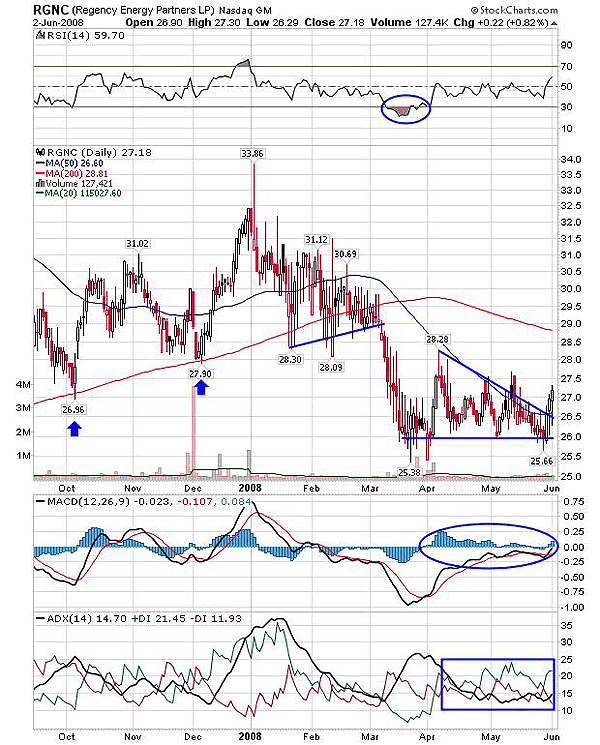
| The descending triangle is a downtrend. This formation breaks in a downward direction and continues the existing bearish rally. However, if the triangle breaks in the opposite direction of an existing trend, a major reversal signal appears. In Figure 1, Regency Energy Partners LP (RGNC) has been declining since January 2008 from 32.5. Initially, the uptrend was clearly indicated by the average directional movement index (ADX) (14), but later, as the stock declined, the uptrend turned weaker. The positive directional Index (+DI) and the negative directional index (-DI) moved closer to each other, indicating the consolidation. The price entered a sideways action with the stable lower range and declining upper range. The price movement formed the descending triangle. On maturity, the triangle headed up instead of a bearish breakout below the lower flat line. So this breakout is a major reversal signal. |

|
| FIGURE 1: RGNC, DAILY. The upside breakout of the descending triangle is a major reversal signal. But the immediate resistance could stop the bullish rally. |
| Graphic provided by: StockCharts.com. |
| |
| During the consolidation, the upper declining line was challenged before the maturity of triangle, and the price retraced back from the 27.5 level toward the lower line. So 27.5 is an immediate resistance for the recent breakout, and the next is a 200-day moving average (MA) resistance. Earlier in 2007, the 200-day MA was tested twice during the correction within a period of three months. And the support was strong enough to begin the pullback rally immediately. But the volatility in 2008 was high and the 200-day MA support was violated, resulting in a serious correction. So this freshly formed resistance will be difficult to be breached. |
| The relative strength index (RSI) (14) has surged above 50 levels offering a buying opportunity. In addition, the moving average convergence/divergence (MACD) (12,26,9) is moving above the zero line, so both indicators are positive toward the breakout. But the ADX (14) does not reflect a strong uptrend. The trend indicator is above 15, with a marginal increase in buying pressure, and therefore, the upside breakout may face hurdles on the bullish path with the target of the 200-day MA. |

|
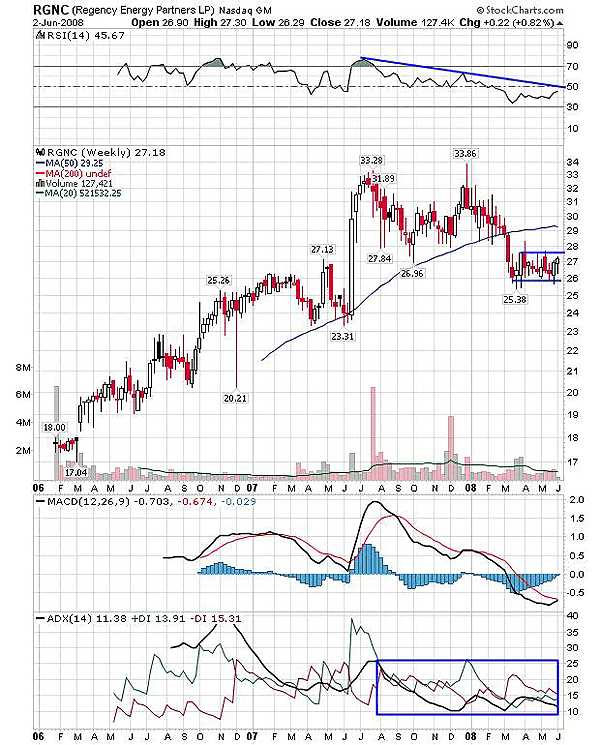
| FIGURE 2: RGNC, WEEKLY. The downward sloping trendline of the RSI (14) is a resistance line. If the trendline is violated, the bullish strength would increase. |
| Graphic provided by: StockCharts.com. |
| |
| During an upside journey, RGNC made a lifetime high at the 33.32 level in 2007 and then corrected sharply. The pullback rally tried to violate the previous high, but the declining RSI (14) and MACD (12,26,9) brought in high bearish pressure, and as a result, the price plunged even below the support of 50-day MA. The ADX (14) moved zigzag in the range of 10-15 and the RSI (14) after the sharp decline was stabilizing near the 50 level. Meanwhile, the MACD (12,26,9) kissed the trigger line for a bullish crossover. RGNC consolidated in the range of 26-28 and thus prevented the further decline. The consolidation formed the bearish flag & pennant pattern. The breakout is not indicated currently as the ADX (14) is weak, and the MACD and RSI are partially bullish. But the breakout in the future would drag RGNC to the previous low at 23 approximately. |
| Thus, RGNC has not turned bullish to carry the rally higher, even though the reversal signal has appeared. I would not recommend any trades in unfavorable conditions like the present. |
Active trader in the Indian stock markets since 2003 and a full-time writer. Trading is largely based upon technical analysis.
| Company: | Independent |
| Address: | C1/3 Parth Indraprasth Towers. Vastrapur |
| Ahmedabad, Guj 380015 | |
| E-mail address: | chaitalimohile@yahoo.co.in |
Traders' Resource Links | |
| Independent has not added any product or service information to TRADERS' RESOURCE. | |
Click here for more information about our publications!
Comments

Request Information From Our Sponsors
- VectorVest, Inc.
- Executive Premier Workshop
- One-Day Options Course
- OptionsPro
- Retirement Income Workshop
- Sure-Fire Trading Systems (VectorVest, Inc.)
- Trading as a Business Workshop
- VectorVest 7 EOD
- VectorVest 7 RealTime/IntraDay
- VectorVest AutoTester
- VectorVest Educational Services
- VectorVest OnLine
- VectorVest Options Analyzer
- VectorVest ProGraphics v6.0
- VectorVest ProTrader 7
- VectorVest RealTime Derby Tool
- VectorVest Simulator
- VectorVest Variator
- VectorVest Watchdog
- StockCharts.com, Inc.
- Candle Patterns
- Candlestick Charting Explained
- Intermarket Technical Analysis
- John Murphy on Chart Analysis
- John Murphy's Chart Pattern Recognition
- John Murphy's Market Message
- MurphyExplainsMarketAnalysis-Intermarket Analysis
- MurphyExplainsMarketAnalysis-Visual Analysis
- StockCharts.com
- Technical Analysis of the Financial Markets
- The Visual Investor
