HOT TOPICS LIST
- MACD
- Fibonacci
- RSI
- Gann
- ADXR
- Stochastics
- Volume
- Triangles
- Futures
- Cycles
- Volatility
- ZIGZAG
- MESA
- Retracement
- Aroon
INDICATORS LIST
LIST OF TOPICS
PRINT THIS ARTICLE
by David Penn
After reaching a high of 40 at the beginning of 2000, Research Frontiers trended to a low of 11.25 by March 2001. Since then, the stock has almost tripled and there may be more upside to come.
Position: N/A
David Penn
Technical Writer for Technical Analysis of STOCKS & COMMODITIES magazine, Working-Money.com, and Traders.com Advantage.
PRINT THIS ARTICLE
TRIANGLES
Going Up: The Triangle Of Research Frontiers
05/25/01 11:56:42 AMby David Penn
After reaching a high of 40 at the beginning of 2000, Research Frontiers trended to a low of 11.25 by March 2001. Since then, the stock has almost tripled and there may be more upside to come.
Position: N/A
| I stumbled onto Research Frontiers (NNM: REFR), a company that designs and licenses "suspended particle" light control technologies, while I was screening stocks for high price/sales multiples for an upcoming article in WORKING MONEY. Whether fundamental information alone is sufficient grist for making stock trading decisions is a debate for some other time. But I have repeatedly found fundamental screens to be helpful ways of discovering stocks that I would have certainly overlooked had I stuck with my preferred technical methods. Finding a stock with some compelling valuation figure, for example, and then consulting that stock's chart for technical strength seems to be a reasonable compromise between the fundamental and technical camps. |
| From the point of view of a long, REFR has a lot of what you would want in a stock. A long downtrend--over a year in this case--with areas of consolidation on the way down is one compelling factor. A downtrend of this duration provids plenty of opportunity for those who want to get out of the stock to get out, and clears the way for those who want to be long the stock to acquire more shares at a better price. |

|
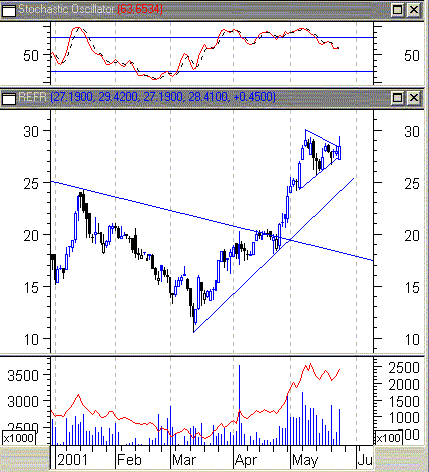
| Figure 1: An intermediate uptrend line serves as support in the event this triangle breaks out downward. However, the 52-week high of 30 could be surpassed by the five-point upside breakout the pattern suggests. |
| Graphic provided by: MetaStock. |
| |
| Here, REFR reached a low of 11.25 in early March. The up trend was relatively sharp, with the stock hitting 20 by the end of April. By early May, Research Frontiers had almost tripled in value from its March low, closing at 29. Currently REFR is consolidating in a fairly standard triangle in which the lows are consecutively higher and the highs are consecutively lower. Generally speaking, triangles like this also feature declining volume throughout the duration of the pattern, with characteristically higher volume on the breakout. |
| Given the size of the triangle, a breakout move of as much as five would not be out of the question. REFR's intermediate trend is up (intermediate being the three months from March 2001 to May 2001) and has clearly broken the longer-term downtrend that began in February 2000 (remnants of that downtrend line are shown on the left). This would suggest that the breakout from this triangle would be on the upside as well. Fortunately, there is some support in the form of REFR's intermediate up trend line, which may help prevent a downside move beyond 25. |
| The upside resistance to a breakout in REFR's triangle is not shown on this graphic. However, the nearest high is 32 and was reached in July 2000. A successful, five-point breakout on the upside would put REFR right in new 52-week high territory, and set the stage for a further advance toward the stock's all-time high of 40 reached in February 2000. |
Technical Writer for Technical Analysis of STOCKS & COMMODITIES magazine, Working-Money.com, and Traders.com Advantage.
| Title: | Technical Writer |
| Company: | Technical Analysis, Inc. |
| Address: | 4757 California Avenue SW |
| Seattle, WA 98116 | |
| Phone # for sales: | 206 938 0570 |
| Fax: | 206 938 1307 |
| Website: | www.Traders.com |
| E-mail address: | DPenn@traders.com |
Traders' Resource Links | |
| Charting the Stock Market: The Wyckoff Method -- Books | |
| Working-Money.com -- Online Trading Services | |
| Traders.com Advantage -- Online Trading Services | |
| Technical Analysis of Stocks & Commodities -- Publications and Newsletters | |
| Working Money, at Working-Money.com -- Publications and Newsletters | |
| Traders.com Advantage -- Publications and Newsletters | |
| Professional Traders Starter Kit -- Software | |
Click here for more information about our publications!
Comments

Request Information From Our Sponsors
- StockCharts.com, Inc.
- Candle Patterns
- Candlestick Charting Explained
- Intermarket Technical Analysis
- John Murphy on Chart Analysis
- John Murphy's Chart Pattern Recognition
- John Murphy's Market Message
- MurphyExplainsMarketAnalysis-Intermarket Analysis
- MurphyExplainsMarketAnalysis-Visual Analysis
- StockCharts.com
- Technical Analysis of the Financial Markets
- The Visual Investor
- VectorVest, Inc.
- Executive Premier Workshop
- One-Day Options Course
- OptionsPro
- Retirement Income Workshop
- Sure-Fire Trading Systems (VectorVest, Inc.)
- Trading as a Business Workshop
- VectorVest 7 EOD
- VectorVest 7 RealTime/IntraDay
- VectorVest AutoTester
- VectorVest Educational Services
- VectorVest OnLine
- VectorVest Options Analyzer
- VectorVest ProGraphics v6.0
- VectorVest ProTrader 7
- VectorVest RealTime Derby Tool
- VectorVest Simulator
- VectorVest Variator
- VectorVest Watchdog
