HOT TOPICS LIST
- MACD
- Fibonacci
- RSI
- Gann
- ADXR
- Stochastics
- Volume
- Triangles
- Futures
- Cycles
- Volatility
- ZIGZAG
- MESA
- Retracement
- Aroon
INDICATORS LIST
LIST OF TOPICS
PRINT THIS ARTICLE
by Chaitali Mohile
Bank of America has formed two reversal patterns that can lead to a serious correction.
Position: N/A
Chaitali Mohile
Active trader in the Indian stock markets since 2003 and a full-time writer. Trading is largely based upon technical analysis.
PRINT THIS ARTICLE
REVERSAL
Can Bank Of America Crack Down Further?
07/16/08 09:14:17 AMby Chaitali Mohile
Bank of America has formed two reversal patterns that can lead to a serious correction.
Position: N/A
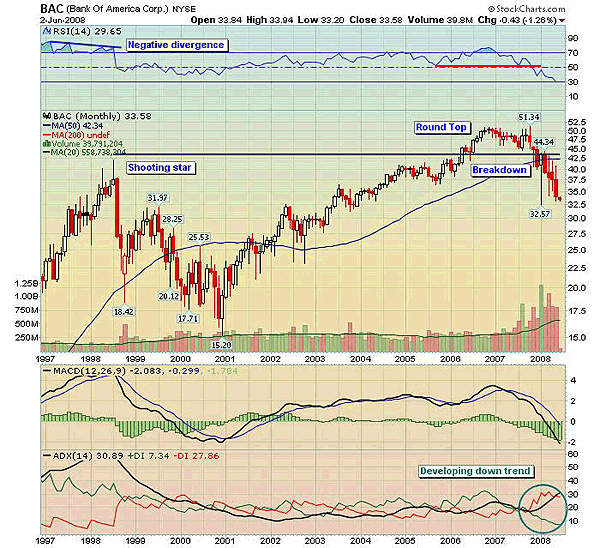
| The growth story of Bank of America Corp. (BAC) halted due to the negative divergence formed by the relative strength index (RSI) (14) and by a shooting star candlestick pattern in 1998. By 2001, the stock lost nearly 70% of its value and the uptrend declined from the overheated levels according to Figure 1. Gradually, the RSI (14) softened and the moving average convergence/divergence (MACD), which was at its low in the negative territory, was ready to surge with the bullish crossover. This indicated a fresh beginning for BAC. |

|
| FIGURE 1: BAC, DAILY. The rounded top pattern has broken down. The bearish indicators are also suggesting the correction in the future. |
| Graphic provided by: StockCharts.com. |
| |
| Initially, due to the struggle between the buyers and the sellers, the price movement was jittery. However, BAC continued to rally, gathering the bullish force and soon violating the previous high resistance of 42.5 (a high made by the shooting star). So the resistance was converted to the strong support in 2006. The breakout rally moved to a new high at 51 and the RSI (14) turned overbought. Thereafter, the price was reluctant to move further and retraced toward a freshly formed support. This particular movement formed the rounded top reversal pattern. In Figure 1, we can see the RSI (14), declining from the overbought area and the increasing volatility of the MACD (12,26,9). This scenario boosted the bears, and the pattern soon broke below the 50-day moving average (MA) support. The bears came out roaring with this breakdown, and the downfall continued. |
| The price moved below the two major supports — first, the 50-day MA and second, the new support area around 42.5 level. Thereafter, BAC formed the lower lows and soon plunged below the 35 level. The RSI (14) tipped downward, indicating declining bullish strength, and after a bearish crossover, the MACD (12,26,9) moved into negative territory. The average directional movement index (ADX) (14) at 30 is indicating a developing downtrend. So there are no signs of a pullback according to Figure 1. But if the Bank index has any positive clues, BAC might see a small relief rally. |

|
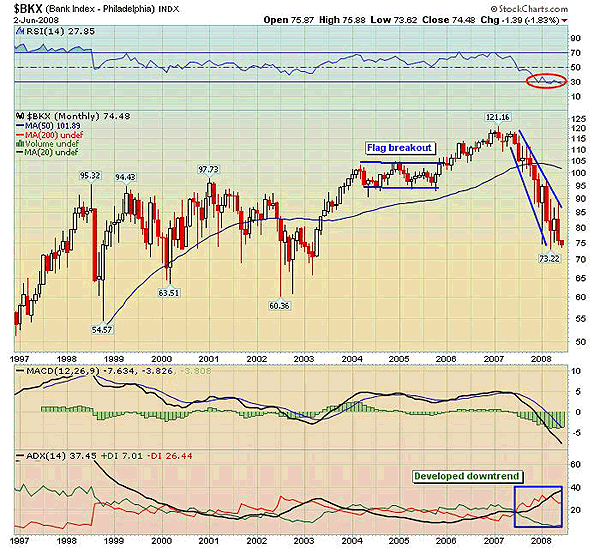
| FIGURE 2: BANK INDEX, MONTHLY. The falling wedge shows no signs of the breakout. |
| Graphic provided by: StockCharts.com. |
| |
| In Figure 2, the advance rally of 35 points was followed by the sideways consolidation in 2004–05. This formed a bullish flag & pennant continuation pattern that breaks in an upward direction. Accordingly, the Bank Index broke up and rallied closer to the estimated level of 140 (105 - 70 = 35 + 105). To calculate the target, the length of a flag pole is added to the breakout level. As the index made the new high, the RSI (14) formed the lower high in the overbought zone and declined. This negative divergence pulled down the price rally, followed by the huge selloff. So without reaching the targeted level, the index plunged down toward the previous low of 70. Currently, the index is at 74, and the RSI (14) has hit the oversold level, indicating further downside. In addition, the ADX (14) indicates a well-developed downtrend. |
| Technically, the possibility of the recovery of the Bank Index has been ruled out. BAC is more likely to crack down further. |
Active trader in the Indian stock markets since 2003 and a full-time writer. Trading is largely based upon technical analysis.
| Company: | Independent |
| Address: | C1/3 Parth Indraprasth Towers. Vastrapur |
| Ahmedabad, Guj 380015 | |
| E-mail address: | chaitalimohile@yahoo.co.in |
Traders' Resource Links | |
| Independent has not added any product or service information to TRADERS' RESOURCE. | |
Click here for more information about our publications!
Comments
Date: 07/18/08Rank: 3Comment:

Request Information From Our Sponsors
- VectorVest, Inc.
- Executive Premier Workshop
- One-Day Options Course
- OptionsPro
- Retirement Income Workshop
- Sure-Fire Trading Systems (VectorVest, Inc.)
- Trading as a Business Workshop
- VectorVest 7 EOD
- VectorVest 7 RealTime/IntraDay
- VectorVest AutoTester
- VectorVest Educational Services
- VectorVest OnLine
- VectorVest Options Analyzer
- VectorVest ProGraphics v6.0
- VectorVest ProTrader 7
- VectorVest RealTime Derby Tool
- VectorVest Simulator
- VectorVest Variator
- VectorVest Watchdog
- StockCharts.com, Inc.
- Candle Patterns
- Candlestick Charting Explained
- Intermarket Technical Analysis
- John Murphy on Chart Analysis
- John Murphy's Chart Pattern Recognition
- John Murphy's Market Message
- MurphyExplainsMarketAnalysis-Intermarket Analysis
- MurphyExplainsMarketAnalysis-Visual Analysis
- StockCharts.com
- Technical Analysis of the Financial Markets
- The Visual Investor
