HOT TOPICS LIST
- MACD
- Fibonacci
- RSI
- Gann
- ADXR
- Stochastics
- Volume
- Triangles
- Futures
- Cycles
- Volatility
- ZIGZAG
- MESA
- Retracement
- Aroon
INDICATORS LIST
LIST OF TOPICS
PRINT THIS ARTICLE
by James Kupfer
The NASDAQ 100 is weak and just keeps getting weaker, but is it ready to turn? And if so, where might it go to?
Position: Buy
James Kupfer
Mr. Kupfer is a market professional and amateur stock market commentator. Disclosure: It is likely that Mr. Kupfer has or will enter a position in any security he writes about.
PRINT THIS ARTICLE
FIBONACCI
NASDAQ 100 At Support
07/16/08 08:50:58 AMby James Kupfer
The NASDAQ 100 is weak and just keeps getting weaker, but is it ready to turn? And if so, where might it go to?
Position: Buy
| Fibonacci retracement levels are a favorite tool of mine to indicate potential reversal levels and price targets. It is common to draw these retracement levels by calculating the popular Fibonacci levels between a stock's recent high and lows. Any decent charting package will do the calculations for you once you select the relevant endpoints. |
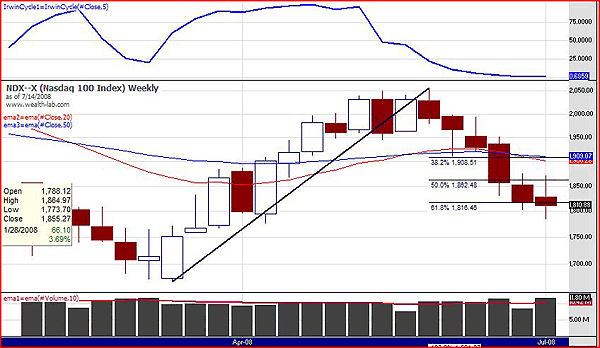
| On the weekly charts of the NASDAQ 100 (Figures 1, 2, and 3), you can see that I have already drawn the appropriate levels. As you can further see, the NASDAQ 100 is hovering right at the 61.8% retracement level and has been for about two weeks. This level is a significant one, and combined with the dramatically oversold stochastic indicator reading, this becomes a critical potential turning point. Although I think it will bounce here, if it does not it has no support until it reaches the March lows. |

|
| FIGURE 1: NDX, WEEKLY. The NASDAQ 100 is hovering around the 61.8% retracement level. |
| Graphic provided by: Wealth-Lab. |
| |
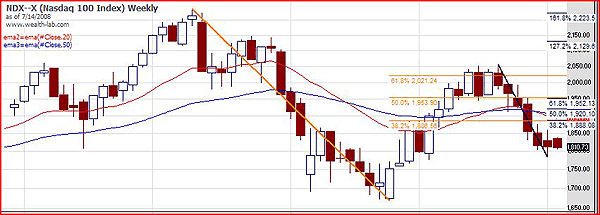
| Assuming a bounce occurs, where can we expect the NASDAQ 100 to bounce to? Again, Fibonacci retracement levels can indicate a potential answer. Drawing Fibonacci retracement levels between the October 2007 market high and the March 2008 lows (long term, in orange), as well as the subsequent May highs and potential lows in July (short term, in black) leads to some interesting results. Specifically, there is a clustering of Fibonacci retracement levels at nearly identical value. At these clustering levels I would expect a significant amount of upward resistance. |

|
| FIGURE 2: NDX, WEEKLY. Assuming a bounce occurs, where can we expect the NASDAQ 100 to bounce to? |
| Graphic provided by: Wealth-Lab. |
| |
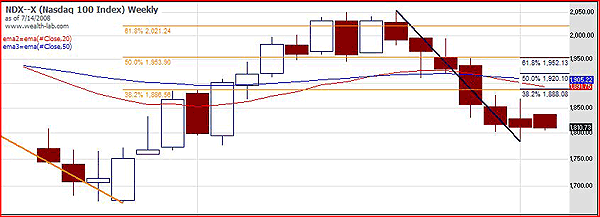
| Short-term support levels are: 61.8%: 1952 50.0%: 1953 38.2%: 1888 Long-term support levels are: 61.8%: 2021 50.0%: 1953 38.2%: 1886 Note that the support levels are very similar at 1952 and 1953, and again at 1888 and 1886. Those are the cluster levels I referred to earlier. |

|
| FIGURE 3: NDX, WEEKLY. Here's a closeup of retracement levels. |
| Graphic provided by: Wealth-Lab. |
| |
| Of course, that doesn't mean the NASDAQ 100 will reach those levels or not even go higher, but they are worth watching closely. |
Mr. Kupfer is a market professional and amateur stock market commentator. Disclosure: It is likely that Mr. Kupfer has or will enter a position in any security he writes about.
Click here for more information about our publications!
PRINT THIS ARTICLE

Request Information From Our Sponsors
- VectorVest, Inc.
- Executive Premier Workshop
- One-Day Options Course
- OptionsPro
- Retirement Income Workshop
- Sure-Fire Trading Systems (VectorVest, Inc.)
- Trading as a Business Workshop
- VectorVest 7 EOD
- VectorVest 7 RealTime/IntraDay
- VectorVest AutoTester
- VectorVest Educational Services
- VectorVest OnLine
- VectorVest Options Analyzer
- VectorVest ProGraphics v6.0
- VectorVest ProTrader 7
- VectorVest RealTime Derby Tool
- VectorVest Simulator
- VectorVest Variator
- VectorVest Watchdog
- StockCharts.com, Inc.
- Candle Patterns
- Candlestick Charting Explained
- Intermarket Technical Analysis
- John Murphy on Chart Analysis
- John Murphy's Chart Pattern Recognition
- John Murphy's Market Message
- MurphyExplainsMarketAnalysis-Intermarket Analysis
- MurphyExplainsMarketAnalysis-Visual Analysis
- StockCharts.com
- Technical Analysis of the Financial Markets
- The Visual Investor
