HOT TOPICS LIST
- MACD
- Fibonacci
- RSI
- Gann
- ADXR
- Stochastics
- Volume
- Triangles
- Futures
- Cycles
- Volatility
- ZIGZAG
- MESA
- Retracement
- Aroon
INDICATORS LIST
LIST OF TOPICS
PRINT THIS ARTICLE
by James Kupfer
Pfizer Inc. is an established downtrend. Has its recent upside correction put it in a position to short?
Position: Sell
James Kupfer
Mr. Kupfer is a market professional and amateur stock market commentator. Disclosure: It is likely that Mr. Kupfer has or will enter a position in any security he writes about.
PRINT THIS ARTICLE
MA ENVELOPES
Pfizer Ready To Short?
07/15/08 11:36:44 AMby James Kupfer
Pfizer Inc. is an established downtrend. Has its recent upside correction put it in a position to short?
Position: Sell
| The moving average (MA) is a frequently used indicator in technical analysis. It shows the average stock's price over a given period and can be used to identify the direction of a price trend. In an uptrend, a short-term exponential moving average (EMA) will stay above a long-term EMA, and the opposite occurs in a downtrend. |
| For swing trading, the "swing zone" between the 20-day EMA and the 50-day EMA can be very important as it provides pullback entry opportunity in a trending stock. If the stock is in an uptrend and enters the swing zone, we can expect a possible buying opportunity. Consider entering a long position when the stock closes above its 20-period EMA. Similarly for a downtrending stock, which enters the swing zone, we can look to short the stock when it closes below its 20-period EMA. |

|
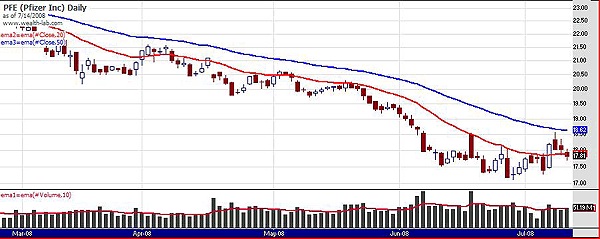
| FIGURE 1: PFE, DAILY. The 20-period EMA (green line) has stayed below the 50-period EMA (red line) for an extended period. |
| Graphic provided by: Wealth-Lab. |
| |
| As shown in Figure 1, the 20-period EMA (green line) has stayed below the 50-period EMA (red line) for an extended period. This demonstrates that the stock is in a downtrend. For the last three days, PFE has stayed in a swing zone, so there is an opportunity to short. On July 11, the stock closed below its 20-period EMA. Now we can potentially short the stock below its last bar's low (that is, $17.68) with an initial stop-loss above the stock's recent high of $18.57. |
Mr. Kupfer is a market professional and amateur stock market commentator. Disclosure: It is likely that Mr. Kupfer has or will enter a position in any security he writes about.
Click here for more information about our publications!
PRINT THIS ARTICLE

Request Information From Our Sponsors
- VectorVest, Inc.
- Executive Premier Workshop
- One-Day Options Course
- OptionsPro
- Retirement Income Workshop
- Sure-Fire Trading Systems (VectorVest, Inc.)
- Trading as a Business Workshop
- VectorVest 7 EOD
- VectorVest 7 RealTime/IntraDay
- VectorVest AutoTester
- VectorVest Educational Services
- VectorVest OnLine
- VectorVest Options Analyzer
- VectorVest ProGraphics v6.0
- VectorVest ProTrader 7
- VectorVest RealTime Derby Tool
- VectorVest Simulator
- VectorVest Variator
- VectorVest Watchdog
- StockCharts.com, Inc.
- Candle Patterns
- Candlestick Charting Explained
- Intermarket Technical Analysis
- John Murphy on Chart Analysis
- John Murphy's Chart Pattern Recognition
- John Murphy's Market Message
- MurphyExplainsMarketAnalysis-Intermarket Analysis
- MurphyExplainsMarketAnalysis-Visual Analysis
- StockCharts.com
- Technical Analysis of the Financial Markets
- The Visual Investor
