HOT TOPICS LIST
- MACD
- Fibonacci
- RSI
- Gann
- ADXR
- Stochastics
- Volume
- Triangles
- Futures
- Cycles
- Volatility
- ZIGZAG
- MESA
- Retracement
- Aroon
INDICATORS LIST
LIST OF TOPICS
PRINT THIS ARTICLE
by Alan R. Northam
With the stock market now officially entering into a bear market, traders are looking to gold as a safe haven for their money. However, gold may not be the safe haven that traders think it is.
Position: N/A
Alan R. Northam
Alan Northam lives in the Dallas, Texas area and as an electronic engineer gave him an analytical mind from which he has developed a thorough knowledge of stock market technical analysis. His abilities to analyze the future direction of the stock market has allowed him to successfully trade of his own portfolio over the last 30 years. Mr. Northam is now retired and trading the stock market full time. You can reach him at inquiry@tradersclassroom.com or by visiting his website at http://www.tradersclassroom.com. You can also follow him on Twitter @TradersClassrm.
PRINT THIS ARTICLE
ELLIOTT WAVE
Is Gold A Safe Haven For Your Money?
07/16/08 02:04:59 PMby Alan R. Northam
With the stock market now officially entering into a bear market, traders are looking to gold as a safe haven for their money. However, gold may not be the safe haven that traders think it is.
Position: N/A
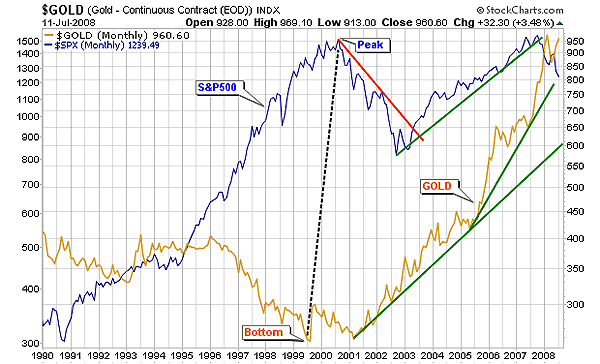
| With the stock market now in a major bear market, traders are looking at gold as a safe haven to put their money. There has been a common belief for investors and traders throughtout the years that the stock market and gold trend inversely with each other, such that when one market goes up, the other goes down. With this in mind, traders are automatically programmed to immediately look to the gold market for their investment dollars once the stock market has entered into a bear market. However, this belief is not valid, as the stock market and the gold market do not always trend in opposite directions. There is a period of time when both of these markets trend together. The business cycle lasts for approximately four years and is divided into six stages. In stage 5, the stock market turns down and in stage 6, the commodity market turns down. Gold is a commodity, and gold also turns down during this later stage. The stock market doesn't turn up again until stage 2 of the business cycle, and commodities don't turn back up until stage 3. So during the latter part of stage 6 and all the way till midstage 2, the stock market and the gold market normally move in the same direction. I believe that the stock and gold markets are now entering into that time frame within the business cycle when both the stock market and the gold market are now starting to trend in the same direction. The stock market peaked in 2007 and has entered into a bear market, while the gold market has now peaked in early 2008 and appears to be in the very early stages of a bear market. Let's look at the evidence. In Figure 1, I have shown a line chart of both the Standard & Poor's 500 and gold. As you can see, from 1996 to 2000, the stock market and gold moved in opposite directions as the stock market moved higher and the gold market moved lower. Then in 2000, the stock market peaked and moved downward until 2002, while the gold market bottomed and started a long bull market upward. However, both markets continued to move in opposite directions. Then in 2002, things changed. The stock market turned back up and has climbed to make a new high in 2007. During this time frame, both the stock market and the gold market moved upward together and did not move in opposite directions. This dispels the theory that the stock market and gold always move in opposite directions. With the stock market and gold moving upward together since 2002, this could be an indication that the business cycle has entered into stage 6. If this is true, then the stock market and gold will most likely continue to move together until stage 2 of the business cycle. With the business cycle typically lasting four years, this could further mean that the stock market and gold could move together for the next year or two. As stage 6 of the business cycle moves along and all through stage 1, both the stock market and gold should continue to move together but in the downward direction. |

|
| FIGURE 1: GOLD, MONTHLY. Here's the monthly line chart showing the market trend of both the S&P 500 and the gold index from 1990 to 2008. This chart shows that gold bottomed in 1999 and stocks peaked in 2000. This chart also shows that both the gold index and the stock market index are trending in the same direction together. |
| Graphic provided by: StockCharts.com. |
| |
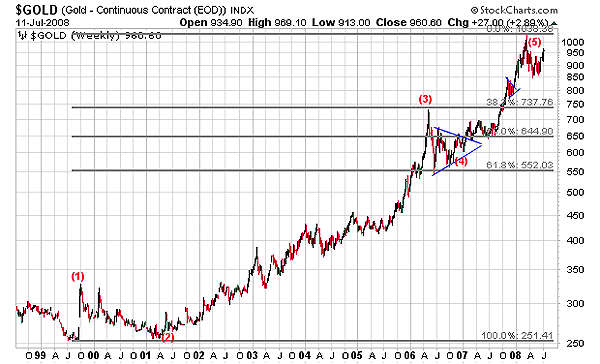
| It is becoming apparent that most investors and traders are starting to realize that the current downward trend in the stock market is more than just a market correction but a real bear market, yet there is still a large number of holdouts who believe that the stock market will turn back up and continue higher. In time, these stragglers will finally give in and join the bear camp. It is also apparent that traders still think the current downtrend in gold is nothing more than a bull market correction and gold will ultimately turn back upward to trend in the opposite direction of the stock market. I don't think so. Let's look at the telltale signs given to us by the trading log of the gold market. Figure 2 is that of the trading log of the gold market. This figure shows the weekly price bars of gold since 1999. Note that from 1999 to 2008, gold has traded upward and has traced out five waves according to my Elliott wave analysis. The Elliott wave principles state that upon completion of five waves up, the market will enter into a market correction that will correct the entire move upward. The Elliott wave guidelines tell us that typically this correction will retrace from 38% to 62% of the upward price movement. I have placed these Fibonacci retracement levels on the price chart for reference. Other retracement areas, according to the Elliott wave guidelines, are the apex of triangles. Therefore, these other retracement areas could be at $800 or even $600 per ounce of gold. As we can see from the chart, gold has not yet approached any of these retracement levels. Therefore, the market correction in gold could have much further to go before it is complete. One point that should be noted is the $800 per ounce retracement level, which represents a 20% decline in price. Traders and investors typically recognize this percentage number as the demarcation line between a bull market correction and a bear market. Therefore, if gold does continue to trade downward to the $800 per ounce level, or even lower, we can begin to see that we are looking at a bear market in gold and not simply a bull market correction. I would now like to draw your attention to the details of the trading activity in gold since the beginning of this year. For this, I have included Figure 3. |

|
| FIGURE 2: GOLD, WEEKLY. Here are the weekly price bars of the gold index. This chart shows a completed five-wave Elliott wave count signaling that the upward trend is complete. This chart also shows the early development of the market correction that normally follows the completion of an uptrend. The Fibonacci retracement levels have been added to the chart as typical price targets for market corrections. Also shown are two triangles whose apex are also possible price targets for market corrections. |
| Graphic provided by: StockCharts.com. |
| |
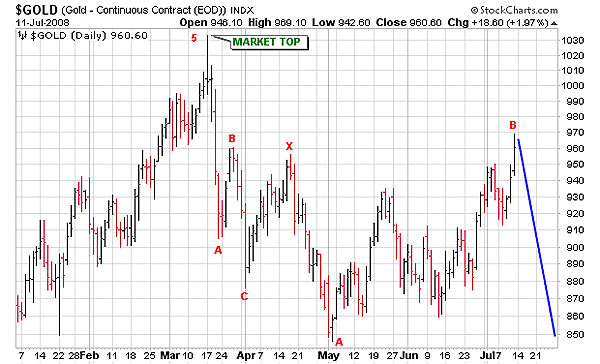
| Figure 3 shows the daily price chart of gold from the beginning of 2008. Note that the gold market peaked in March. During the month, gold traded downward and formed an ABC zigzag corrective pattern. During April, this market traded upward and formed an X wave. X waves connect multiple corrective patterns together. From mid-April to the present date, gold appears to be in the process of forming a second ABC zigzag pattern and looks to have either completed wave B or is very close to completing wave B of this second ABC zigzag corrective pattern. Once wave B is complete, we can expect gold to continue to sell off to complete wave C. We can also expect this selloff to continue down to the retracement levels. |

|
| FIGURE 3: GOLD, DAILY. Here are the daily price bars of the gold index. This chart shows the corrective rally to date and is labeled with the Elliott wave count. This chart shows the completion of the first ABC zigzag corrective wave and waves A and B of a second zigzag corrective wave. Wave C of the second ABC zigzag is yet to unfold and its expected path is shown as a blue downward sloping line. This chart also shows that the first and second ABC zigzag corrective waves are connected together by an upward sloping X wave. |
| Graphic provided by: StockCharts.com. |
| |
| In conclusion, we have also learned that the gold market completed five waves up from 1999. The gold market then peaked in 2008 and has entered into a market correction. This market correction looks to be tracing out a double zigzag corrective pattern that could draw this market down to $750 to $550 per ounce. This market correction could be of such proportions that it will appear to be more than just a bull market correction in gold, but will begin to feel like a real bear market. We have also learned that the business cycle lasts approximately four years and is divided into six stages. We have further learned that gold is a commodity and that commodities trend in the downward direction from midstage 6 to midstage 3 of the business cycle. Therefore, we can expect the current bear market in gold to last as much as half the length of a typical business cycle, or from one to two years. And finally, we have seen that the stock market and the gold market do not always move in opposite directions as is commonly believed but that they have been moving together in the same direction ever since 2002. |
Alan Northam lives in the Dallas, Texas area and as an electronic engineer gave him an analytical mind from which he has developed a thorough knowledge of stock market technical analysis. His abilities to analyze the future direction of the stock market has allowed him to successfully trade of his own portfolio over the last 30 years. Mr. Northam is now retired and trading the stock market full time. You can reach him at inquiry@tradersclassroom.com or by visiting his website at http://www.tradersclassroom.com. You can also follow him on Twitter @TradersClassrm.
| Garland, Tx | |
| Website: | www.tradersclassroom.com |
| E-mail address: | inquiry@tradersclassroom.com |
Click here for more information about our publications!
Comments
Date: 07/18/08Rank: 5Comment:
Date: 07/22/08Rank: 1Comment: While you are correct that gold has a tenuous correlation to equities - it does correlate with currencies. Therefore - your article doesn t really tell us much.

Request Information From Our Sponsors
- StockCharts.com, Inc.
- Candle Patterns
- Candlestick Charting Explained
- Intermarket Technical Analysis
- John Murphy on Chart Analysis
- John Murphy's Chart Pattern Recognition
- John Murphy's Market Message
- MurphyExplainsMarketAnalysis-Intermarket Analysis
- MurphyExplainsMarketAnalysis-Visual Analysis
- StockCharts.com
- Technical Analysis of the Financial Markets
- The Visual Investor
- VectorVest, Inc.
- Executive Premier Workshop
- One-Day Options Course
- OptionsPro
- Retirement Income Workshop
- Sure-Fire Trading Systems (VectorVest, Inc.)
- Trading as a Business Workshop
- VectorVest 7 EOD
- VectorVest 7 RealTime/IntraDay
- VectorVest AutoTester
- VectorVest Educational Services
- VectorVest OnLine
- VectorVest Options Analyzer
- VectorVest ProGraphics v6.0
- VectorVest ProTrader 7
- VectorVest RealTime Derby Tool
- VectorVest Simulator
- VectorVest Variator
- VectorVest Watchdog
