HOT TOPICS LIST
- MACD
- Fibonacci
- RSI
- Gann
- ADXR
- Stochastics
- Volume
- Triangles
- Futures
- Cycles
- Volatility
- ZIGZAG
- MESA
- Retracement
- Aroon
INDICATORS LIST
LIST OF TOPICS
PRINT THIS ARTICLE
by Chaitali Mohile
After establishing strong support, AT&T is likely to undergo a volatile bullish consolidation.
Position: N/A
Chaitali Mohile
Active trader in the Indian stock markets since 2003 and a full-time writer. Trading is largely based upon technical analysis.
PRINT THIS ARTICLE
VOLATILITY
AT&T In Volatile Consolidation Phase
07/15/08 11:33:27 AMby Chaitali Mohile
After establishing strong support, AT&T is likely to undergo a volatile bullish consolidation.
Position: N/A
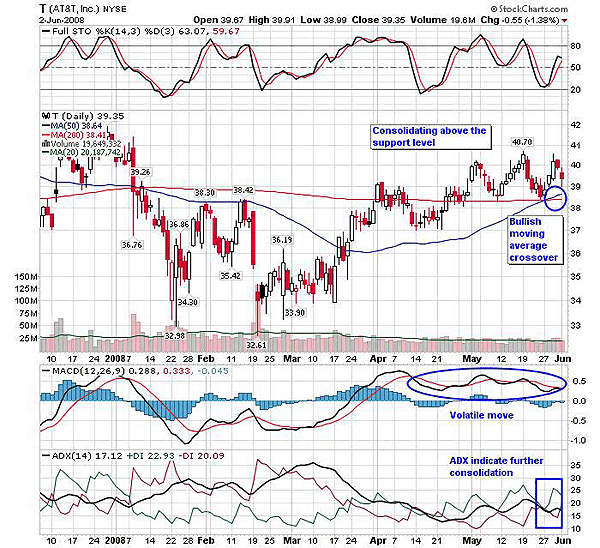
| Highly volatile rallies can be seen across the daily chart of AT&T (Figure 1). The 50-day and 200-day moving averages both were frequently tested as support- resistance. The stochastic oscillator (14,3,3) could not be sustained in the overbought and oversold zones for a longer period. The oscillator showed a sharp recovery from the oversold area and an equally sharp decline from the overbought levels. Similarly, the moving average convergence/divergence (MACD) (12,26,9) was flirting with the trigger line in the positive and negative areas. This indicates that the volatility was at its peak in whatever direction the price moved. The decline below the 200-day moving average (MA) in January 2008 dragged the price down to 32.68-32.91 level. Here, the short -term downtrend came in clearly and was sustained for almost two months. |

|
| FIGURE 1: T, DAILY. A consolidation across the moving average support is highly important. The indicators are suggesting high volatility during the consolidation phase. |
| Graphic provided by: StockCharts.com. |
| |
| AT&T (T) formed a bottom in the range of 32-33, but this formation was quite different from the usual bottom formation. The spikes formed lower lows or just kissed the lower range, but the fast recovery of the stochastic (14,3,3) from the oversold area stopped the price from moving lower. As a result, this bottom accumulated strength for the next rally in the direction of the 50-day MA and the 200-day MA. But due to high volatility and sluggish trend development, the breakout turned sideways. In addition, the volume was also a point of concern. The breakout pulled the volatile MACD (12,26,9) to the positive area and the stochastic (14,3,3) moved above 50 (bullish area though not overbought), indicating bullish strength. The average directional movement Index (ADX) (14) managed to move above 15 with equal selling and buying pressure. The ADX (14) therefore indicates consolidation. |

|
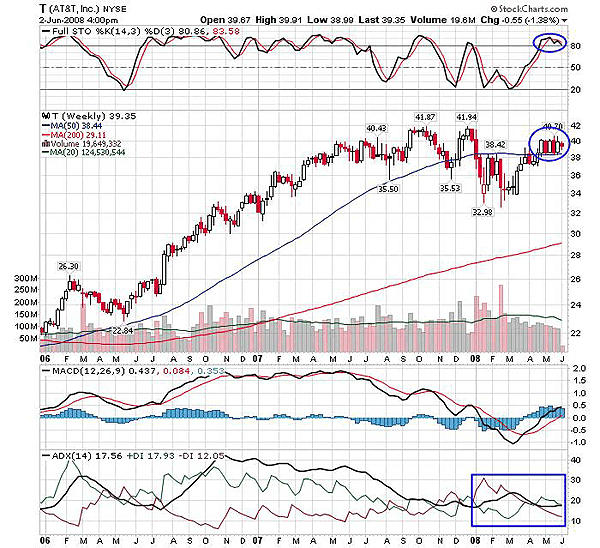
| FIGURE 2: T, WEEKLY. The stochastic (14,3,3) is likely to decline below 80, the MACD (12,26,9) is ready to move above zero line, and the ADX (14) at current level of 17 indicates consolidation. |
| Graphic provided by: StockCharts.com. |
| |
| In Figure 2, the stock has been heading up in the direction of the 50-day MA. T formed the double-top pattern at the new high of 41.87. With this top reversal formation, the bears rushed in and dragged the price below the strong support of the 50-day MA. Following the price movement, the stochastic (14,3,3) also declined toward the oversold zone. The declining uptrend was now converted to a downtrend. The MACD (12,26,9) was at the lowest level in negative territory and the stochastic (14,3,3) formed the double bottom with the support of 20 level (oversold level). Both indicators suggested the relief rally was in a downtrend. |
| The rally began with the support of 34 and gradually moved toward the previous support of the 50-day MA. This upside rally pulled the MACD (12,26,9) into positive territory and the stochastic (14,3,3) to the overbought area. Since the ADX (14) is currently trapped between the positive directional index (+DI) and the negative directional index, the rally consolidated with the 50-day MA support. Further, the overbought stochastic (14,3,3) is ready to leave the 80 support. The MACD (12,26,9) is the only bullish indicator. |
| With the mixed views from the indicators and the price movement, the volatility is likely to sustain throughout the consolidation. If all the indicators turn highly negative, then the 50-day MA support may get violated and T can plunge to the previous low at 34. |
Active trader in the Indian stock markets since 2003 and a full-time writer. Trading is largely based upon technical analysis.
| Company: | Independent |
| Address: | C1/3 Parth Indraprasth Towers. Vastrapur |
| Ahmedabad, Guj 380015 | |
| E-mail address: | chaitalimohile@yahoo.co.in |
Traders' Resource Links | |
| Independent has not added any product or service information to TRADERS' RESOURCE. | |
Click here for more information about our publications!
PRINT THIS ARTICLE

Request Information From Our Sponsors
- StockCharts.com, Inc.
- Candle Patterns
- Candlestick Charting Explained
- Intermarket Technical Analysis
- John Murphy on Chart Analysis
- John Murphy's Chart Pattern Recognition
- John Murphy's Market Message
- MurphyExplainsMarketAnalysis-Intermarket Analysis
- MurphyExplainsMarketAnalysis-Visual Analysis
- StockCharts.com
- Technical Analysis of the Financial Markets
- The Visual Investor
- VectorVest, Inc.
- Executive Premier Workshop
- One-Day Options Course
- OptionsPro
- Retirement Income Workshop
- Sure-Fire Trading Systems (VectorVest, Inc.)
- Trading as a Business Workshop
- VectorVest 7 EOD
- VectorVest 7 RealTime/IntraDay
- VectorVest AutoTester
- VectorVest Educational Services
- VectorVest OnLine
- VectorVest Options Analyzer
- VectorVest ProGraphics v6.0
- VectorVest ProTrader 7
- VectorVest RealTime Derby Tool
- VectorVest Simulator
- VectorVest Variator
- VectorVest Watchdog
