HOT TOPICS LIST
- MACD
- Fibonacci
- RSI
- Gann
- ADXR
- Stochastics
- Volume
- Triangles
- Futures
- Cycles
- Volatility
- ZIGZAG
- MESA
- Retracement
- Aroon
INDICATORS LIST
LIST OF TOPICS
PRINT THIS ARTICLE
by David Penn
After breaking out of a three-month consolidation range, Jones Apparel gained 12% before parking in the mid 40s. Fortunately for JNY longs, the stocks parked in an ascending triangle.
Position: N/A
David Penn
Technical Writer for Technical Analysis of STOCKS & COMMODITIES magazine, Working-Money.com, and Traders.com Advantage.
PRINT THIS ARTICLE
ASCENDING TRIANGLES
Joltin' Jones Apparel's Ascending Triangle
05/24/01 10:11:28 AMby David Penn
After breaking out of a three-month consolidation range, Jones Apparel gained 12% before parking in the mid 40s. Fortunately for JNY longs, the stocks parked in an ascending triangle.
Position: N/A
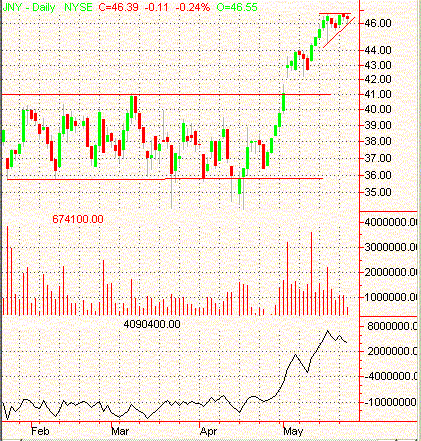
| When Jones Apparel (JNY) broke out of its three-month consolidation pattern, the stock had become the darling of both fundamentally oriented investors enjoying a resurgence in the retail industry (Jones Apparel is a leading distributor and marketer of branded clothing, footwear and accessories) and technically oriented traders noting the upsurge in buying volume. JNY has not disappointed. True to form, JNY's three-month consolidation pattern spanned a price range of about 5, from just under 36 to just over 41, which yielded a price objective of 46 when (and, at the time, if) the stock broke out on the upside. After breaking out on the first of May, JNY was trading at 46.45 by May 22nd. |
| The question for those who were able to take advantage of this move--as well as those who weren't--is this: will Jones Apparel climb higher? Or should profits on a move like this be taken swiftly? While timing when to take profits is a matter as personal as hygiene, there are some factors that can help determine when a move might have exhausted itself and when a stock might indeed be headed for higher ground. |

|
| Figure 1: From consolidation to breakout to consolidation, shares of JNY moved 12%. If the ascending triangle is any indication, JNY has more room to move on the upside. |
| Graphic provided by: TradeStation. |
| |
| Here, JNY reached its price objective while slipping into an ascending triangle. Triangles are generally considered to be continuation patterns, areas of congestion and increasing (though often fleeting) consensus on the value of the stock in question that tend to represent temporary stopping points along a prevailing trend. The ascending triangle here is a continuation triangle, as well. But more importantly, the ascending triangle is considered a particularly bullish triangle. Ascending triangles are bullish insofar as top prices reach upside resistance, while the range grows increasingly smaller. |
| This is certainly the case in the ascending triangle at the top of JNY's advance in May. Prices have topped out at about 46.75. Yet the range lows have been consistently rising, as the graphic shows. Like a coiled spring, ascending triangles become more and more compressed until they eventually breakout. The direction of the range lows, which are rising, is the hint that the breakout is likely to be on the upside. |
| So if JNY has more room to move on the upside, just how much room is there? Measuring the ascending triangle from topside resistance to the lowest point in the formation (usually at the beginning), and adding that value to the value at resistance is the standard rule. Here a formation height of 1.4 added to a topside resistance value of 46 gives an upside objective of 47.4. For position traders, a move of 1.4 may or may not be worth pursuing. But for those with shorter time frames, an overall move of this size could prove to be fruitful territory for intra-day trades. It might be added that 47.4 would represent a new high for JNY, which would likely reinvigorate trading interest (albeit potentially on both the long and short sides). |
Technical Writer for Technical Analysis of STOCKS & COMMODITIES magazine, Working-Money.com, and Traders.com Advantage.
| Title: | Technical Writer |
| Company: | Technical Analysis, Inc. |
| Address: | 4757 California Avenue SW |
| Seattle, WA 98116 | |
| Phone # for sales: | 206 938 0570 |
| Fax: | 206 938 1307 |
| Website: | www.Traders.com |
| E-mail address: | DPenn@traders.com |
Traders' Resource Links | |
| Charting the Stock Market: The Wyckoff Method -- Books | |
| Working-Money.com -- Online Trading Services | |
| Traders.com Advantage -- Online Trading Services | |
| Technical Analysis of Stocks & Commodities -- Publications and Newsletters | |
| Working Money, at Working-Money.com -- Publications and Newsletters | |
| Traders.com Advantage -- Publications and Newsletters | |
| Professional Traders Starter Kit -- Software | |
Click here for more information about our publications!
Comments

Request Information From Our Sponsors
- StockCharts.com, Inc.
- Candle Patterns
- Candlestick Charting Explained
- Intermarket Technical Analysis
- John Murphy on Chart Analysis
- John Murphy's Chart Pattern Recognition
- John Murphy's Market Message
- MurphyExplainsMarketAnalysis-Intermarket Analysis
- MurphyExplainsMarketAnalysis-Visual Analysis
- StockCharts.com
- Technical Analysis of the Financial Markets
- The Visual Investor
- VectorVest, Inc.
- Executive Premier Workshop
- One-Day Options Course
- OptionsPro
- Retirement Income Workshop
- Sure-Fire Trading Systems (VectorVest, Inc.)
- Trading as a Business Workshop
- VectorVest 7 EOD
- VectorVest 7 RealTime/IntraDay
- VectorVest AutoTester
- VectorVest Educational Services
- VectorVest OnLine
- VectorVest Options Analyzer
- VectorVest ProGraphics v6.0
- VectorVest ProTrader 7
- VectorVest RealTime Derby Tool
- VectorVest Simulator
- VectorVest Variator
- VectorVest Watchdog
