HOT TOPICS LIST
- MACD
- Fibonacci
- RSI
- Gann
- ADXR
- Stochastics
- Volume
- Triangles
- Futures
- Cycles
- Volatility
- ZIGZAG
- MESA
- Retracement
- Aroon
INDICATORS LIST
LIST OF TOPICS
PRINT THIS ARTICLE
by Alan R. Northam
XLF made a market top in May 2007 and has been trading lower ever since. Now it looks as if XLF is close to a market correction that could retrace from 38% to 62% of the ground lost in the decline.
Position: N/A
Alan R. Northam
Alan Northam lives in the Dallas, Texas area and as an electronic engineer gave him an analytical mind from which he has developed a thorough knowledge of stock market technical analysis. His abilities to analyze the future direction of the stock market has allowed him to successfully trade of his own portfolio over the last 30 years. Mr. Northam is now retired and trading the stock market full time. You can reach him at inquiry@tradersclassroom.com or by visiting his website at http://www.tradersclassroom.com. You can also follow him on Twitter @TradersClassrm.
PRINT THIS ARTICLE
ELLIOTT WAVE
Financial Select SPDR Correction Ahead
07/15/08 09:47:35 AMby Alan R. Northam
XLF made a market top in May 2007 and has been trading lower ever since. Now it looks as if XLF is close to a market correction that could retrace from 38% to 62% of the ground lost in the decline.
Position: N/A
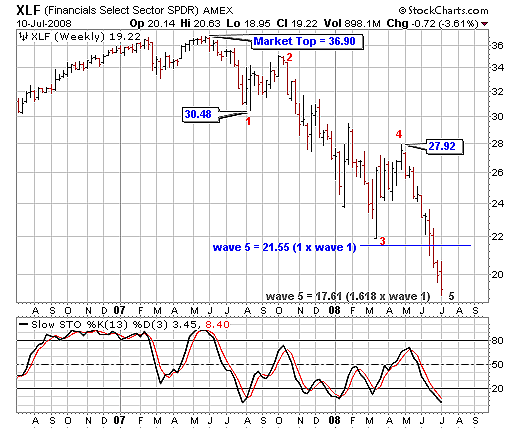
| Financial Select SPDR (XLF) made a major bull market top in May 2007. Since then, XLF has been trading downward and has moved in five waves (1, 2, 3, 4, and 5) as shown in Figure 1. Waves 1 through 4 are complete, with wave 5 yet to be completed. I show wave 5 in gray to signify that it is not yet completed. Once wave 5 is complete, this market will enter into a correction that could rally upward and retrace as much as 62% of the ground lost during the May 2007 decline. Just how close are we to a market correction? Let's take a look. Wave 5 normally ends when its price range is equal to that of wave 1 subtracted from the price maximum of wave 4. I show this target price in Figure 1 to be 21.55. As you can see, XLF has traded right through this target and is continuing lower. The next target occurs when wave 5 is equal to 1.618 times the price range of wave 1 subtracted from the price maximum of wave 4. This calculates to be at a price of 17.61. As you can see, the market is not quite there yet, but it is closing in on this target. Looking at the stochastic indicator below the price chart, we can see that XLF is oversold, supporting our analysis that this market could be close to entering a correction. |

|
| FIGURE 1: XLF, WEEKLY. XLF traded through the target of 21.55 and kept right on dropping. |
| Graphic provided by: StockCharts.com. |
| |
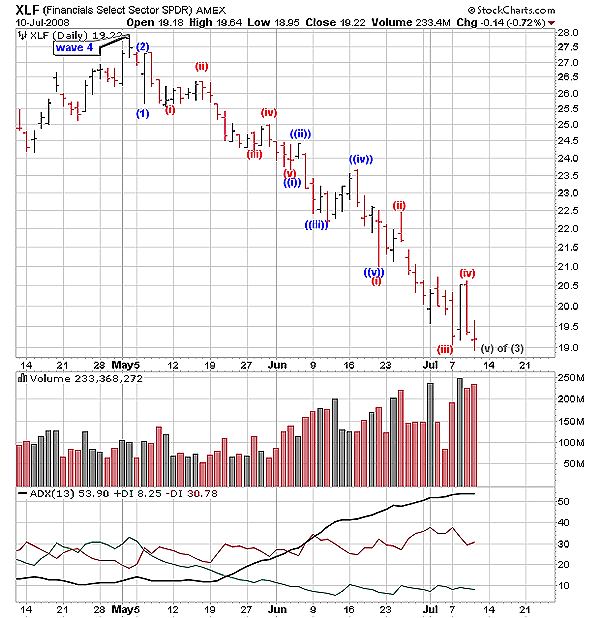
| Figure 2 shows the daily price chart for XLF and the detail of wave 4 down. Looking at the wave count, we can see that wave (v) of wave (3) still needs to be completed. Once wave (3) is completed, then XLF will undergo a small wave (4) correction followed by the final wave (5) down. Once wave (5) down is complete, that will also complete wave 5 down (refer back to Figure 1). |

|
| FIGURE 2: XLF, DAILY. Lookig at the wave count, we can see that wave (v) of wave (3) still needs to be completed. |
| Graphic provided by: StockCharts.com. |
| |
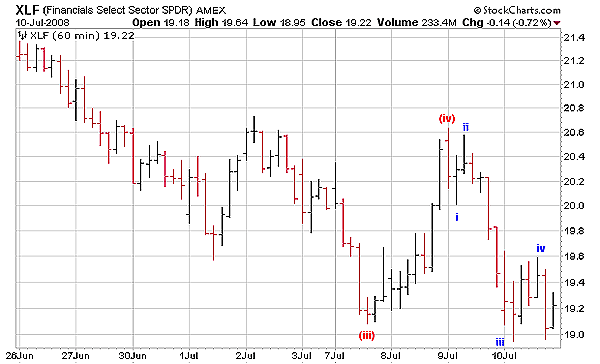
| In Figure 3 we zero in for a closer look at wave (5) down by looking at the 60-minute chart. Here we can see that subwaves i, ii, iii, and iv are now complete, with wave v yet to be completed. So all that has to be completed to finish wave 5 (from Figure 1) is to the final subwave, wave v. |

|
| FIGURE 3: XLF, 60-MINUTE. All that has to be completed to complete wave 5 (from Figure 1) is to complete the final subwave, wave v. |
| Graphic provided by: StockCharts.com. |
| |
| Figure 4 looks at the detail of this final wave v. Figure 4 is that of the 10-minute chart of XLF. In this figure we can see that subwave (i) is complete and wave (ii), a corrective wave, is well developed and could be complete, but wave (iii) down has not yet started to confirm that wave (ii) is complete. |

|
| FIGURE 4: XLF, 10-MINUTE. Subwave (1) is complete and wave (ii), a corrective wave, is well developed and could be complete, wave (iii) down has not yet started to confirm that wave (ii) is complete. |
| Graphic provided by: StockCharts.com. |
| |
| From this analysis, we can see that XLF should continue to move lower from its current price level as wave (iii) down, wave (iv), a small corrective wave, and a final wave (v) down are yet to unfold. These last three remaining waves are probably just enough to move XLF lower to our 17.61 target price. In conclusion, XLF is close to completing five waves down, and once these five waves are complete, we can expect this market to correct from 38% to as much as 62% of the ground lost from its May 2007 decline. |
Alan Northam lives in the Dallas, Texas area and as an electronic engineer gave him an analytical mind from which he has developed a thorough knowledge of stock market technical analysis. His abilities to analyze the future direction of the stock market has allowed him to successfully trade of his own portfolio over the last 30 years. Mr. Northam is now retired and trading the stock market full time. You can reach him at inquiry@tradersclassroom.com or by visiting his website at http://www.tradersclassroom.com. You can also follow him on Twitter @TradersClassrm.
| Garland, Tx | |
| Website: | www.tradersclassroom.com |
| E-mail address: | inquiry@tradersclassroom.com |
Click here for more information about our publications!
Comments
Date: 07/11/08Rank: 5Comment:

Request Information From Our Sponsors
- StockCharts.com, Inc.
- Candle Patterns
- Candlestick Charting Explained
- Intermarket Technical Analysis
- John Murphy on Chart Analysis
- John Murphy's Chart Pattern Recognition
- John Murphy's Market Message
- MurphyExplainsMarketAnalysis-Intermarket Analysis
- MurphyExplainsMarketAnalysis-Visual Analysis
- StockCharts.com
- Technical Analysis of the Financial Markets
- The Visual Investor
- VectorVest, Inc.
- Executive Premier Workshop
- One-Day Options Course
- OptionsPro
- Retirement Income Workshop
- Sure-Fire Trading Systems (VectorVest, Inc.)
- Trading as a Business Workshop
- VectorVest 7 EOD
- VectorVest 7 RealTime/IntraDay
- VectorVest AutoTester
- VectorVest Educational Services
- VectorVest OnLine
- VectorVest Options Analyzer
- VectorVest ProGraphics v6.0
- VectorVest ProTrader 7
- VectorVest RealTime Derby Tool
- VectorVest Simulator
- VectorVest Variator
- VectorVest Watchdog
