HOT TOPICS LIST
- MACD
- Fibonacci
- RSI
- Gann
- ADXR
- Stochastics
- Volume
- Triangles
- Futures
- Cycles
- Volatility
- ZIGZAG
- MESA
- Retracement
- Aroon
INDICATORS LIST
LIST OF TOPICS
PRINT THIS ARTICLE
by Mike Carr, CMT
The Canadian benchmark index is showing signs of weakness, and potential weakness for gold.
Position: Sell
Mike Carr, CMT
Mike Carr, CMT, is a member of the Market Technicians Association, and editor of the MTA's newsletter, Technically Speaking. He is also the author of "Smarter Investing in Any Economy: The Definitive Guide to Relative Strength Investing," and "Conquering the Divide: How to Use Economic Indicators to Catch Stock Market Trends."
PRINT THIS ARTICLE
STRATEGIES
Intermarket Analysis With Canadian Stocks And Gold
07/10/08 02:37:10 PMby Mike Carr, CMT
The Canadian benchmark index is showing signs of weakness, and potential weakness for gold.
Position: Sell
| The Canadian Toronto TSX 300 has shown signs of topping in recent days and has fallen slightly more than 10% over the past month before recovering somewhat. The market has been led lower by the metal and mining sub index, the largest sector in the market. |
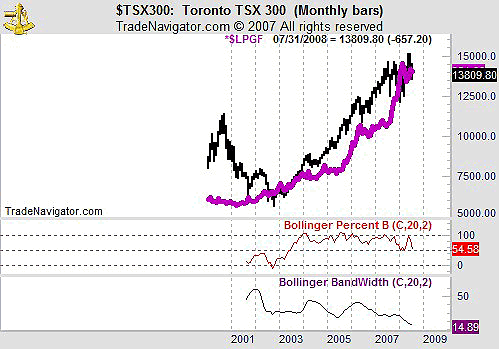
| The monthly chart (Figure 1) shows the strong correlation between the TSX and the price of gold. Both have moved higher in lockstep over the past five years. The recent downward move in the stock index has been matched by an equally sharp move in the price of gold. In the bottom of Figure 1 we can see that volatility, as measured by the Bollinger bandwidth is at historic low levels. This means that volatility is likely to increase, and other indicators tell us that prices are more likely to decline than rise in the coming move. |

|
| FIGURE 1: TSX, MONTHLY. The close correlation between the price of gold and Canadian stocks is easy to see in this chart. The cyclical nature of volatility is also evident in the bottom clip. |
| Graphic provided by: Trade Navigator. |
| |
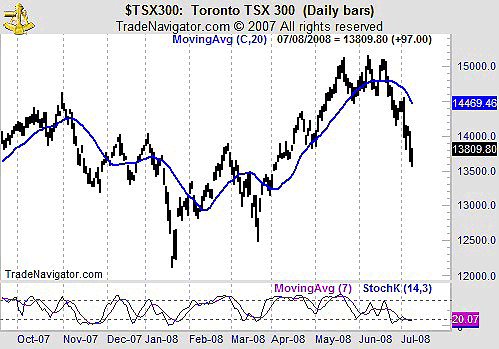
| The daily chart (Figure 2) supports the bearish case. Prices have completed a triple-top pattern and the stochastic has failed to confirm the recent highs. This bearish divergence in momentum was confirmed by the price break that occurred in the past few weeks. The current price is at a long-term support level and a move lower is likely to go to the 12,500 level. |

|
| FIGURE 2: TSX, DAILY. The daily chart shows that the 20-day moving average has rolled over and prices have decisively moved into a downtrend. |
| Graphic provided by: Trade Navigator. |
| |
| With Canadian stocks heading lower, gold is likely to follow. This is an example of intermarket analysis using nontraditional markets like Canadian stocks to develop an opinion on the larger trends. In this case, traders should be prepared for commodities to head lower, led by gold. |
Mike Carr, CMT, is a member of the Market Technicians Association, and editor of the MTA's newsletter, Technically Speaking. He is also the author of "Smarter Investing in Any Economy: The Definitive Guide to Relative Strength Investing," and "Conquering the Divide: How to Use Economic Indicators to Catch Stock Market Trends."
| Website: | www.moneynews.com/blogs/MichaelCarr/id-73 |
| E-mail address: | marketstrategist@gmail.com |
Click here for more information about our publications!
Comments
Date: 07/22/08Rank: 4Comment:

Request Information From Our Sponsors
- StockCharts.com, Inc.
- Candle Patterns
- Candlestick Charting Explained
- Intermarket Technical Analysis
- John Murphy on Chart Analysis
- John Murphy's Chart Pattern Recognition
- John Murphy's Market Message
- MurphyExplainsMarketAnalysis-Intermarket Analysis
- MurphyExplainsMarketAnalysis-Visual Analysis
- StockCharts.com
- Technical Analysis of the Financial Markets
- The Visual Investor
- VectorVest, Inc.
- Executive Premier Workshop
- One-Day Options Course
- OptionsPro
- Retirement Income Workshop
- Sure-Fire Trading Systems (VectorVest, Inc.)
- Trading as a Business Workshop
- VectorVest 7 EOD
- VectorVest 7 RealTime/IntraDay
- VectorVest AutoTester
- VectorVest Educational Services
- VectorVest OnLine
- VectorVest Options Analyzer
- VectorVest ProGraphics v6.0
- VectorVest ProTrader 7
- VectorVest RealTime Derby Tool
- VectorVest Simulator
- VectorVest Variator
- VectorVest Watchdog
