HOT TOPICS LIST
- MACD
- Fibonacci
- RSI
- Gann
- ADXR
- Stochastics
- Volume
- Triangles
- Futures
- Cycles
- Volatility
- ZIGZAG
- MESA
- Retracement
- Aroon
INDICATORS LIST
LIST OF TOPICS
PRINT THIS ARTICLE
by Mike Carr, CMT
The market is oversold and could become more oversold, but dividends can provide income in case the decline continues.
Position: Buy
Mike Carr, CMT
Mike Carr, CMT, is a member of the Market Technicians Association, and editor of the MTA's newsletter, Technically Speaking. He is also the author of "Smarter Investing in Any Economy: The Definitive Guide to Relative Strength Investing," and "Conquering the Divide: How to Use Economic Indicators to Catch Stock Market Trends."
PRINT THIS ARTICLE
STRATEGIES
Bottom-Fishing For Potential Winners
07/10/08 02:28:09 PMby Mike Carr, CMT
The market is oversold and could become more oversold, but dividends can provide income in case the decline continues.
Position: Buy
| PowerShares HighYield Dividend Achievers (PEY) offers a 6.1% yield, better than long-term Treasuries and many corporate bonds. It holds stocks to replicate an index called the Dividend Achievers 50, which consists of companies with a long and consistent record of dividend increases. In theory, holding 50 stocks provides diversification and a margin of safety against dividend cuts. Many of the stocks in the portfolio are financial stocks, which have suffered significant declines in recent months as the subprime crisis unfolded. |
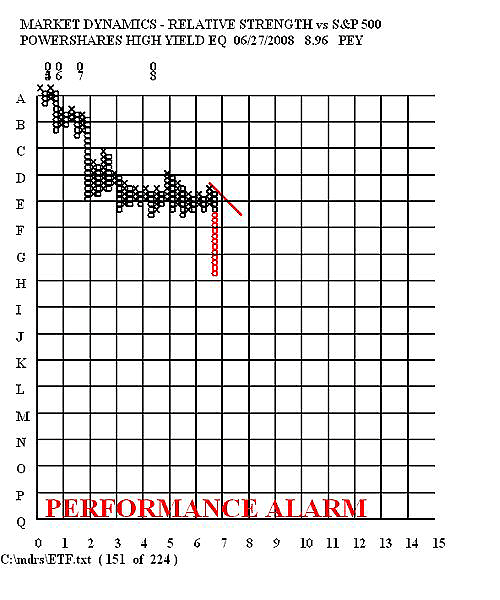
| PEY is more oversold than any other exchange traded fund (ETF) in the market (Figure 1). Does that mean it must stop declining? Certainly not. However, it does mean that PEY is more likely to bounce when the market does stop declining. This logic does not apply to individual stocks. They can fall to zero, but ETFs are unlikely to lose all of their value unless more than four dozen stocks completely collapse. |

|
| FIGURE 1: PEY. The point & figure chart of relative strength shows an extreme oversold condition. |
| Graphic provided by: Market Dynamics. |
| |
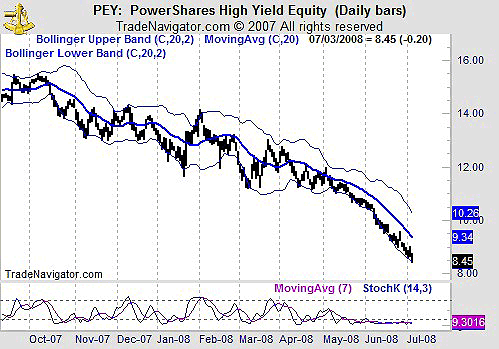
| Prices (Figure 2) confirm the degree of the recent decline. The stochastics indicator has been oversold for more than six weeks. A bullish crossover at this level is very likely to signal at least a short-term price trend reversal. |

|
| FIGURE 2: PEY, DAILY. The daily chart shows the degree of selling that has accompanied the most recent price decline. |
| Graphic provided by: Trade Navigator. |
| |
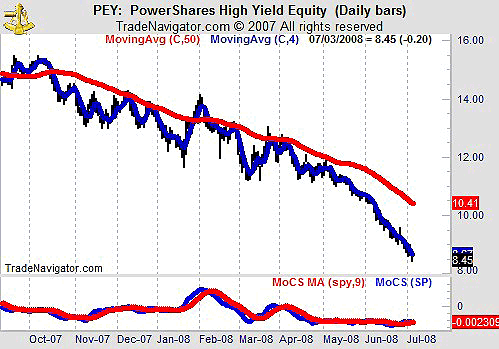
| Figure 3 shows the only potentially bullish signal evident in an analysis of the stock. Although difficult to see, daily relative strength has just crossed above its moving average. This indicator, the momentum of comparative strength (MOCS), applies a moving average convergence/divergence (MACD)–like calculation to relative strength rather than price. |

|
| FIGURE 3: PEY, DAILY. The daily relative strength is potentially turning up. |
| Graphic provided by: Trade Navigator. |
| |
| Aggressive traders can buy PEY at current levels, using a percentage stop of 10–12% to limit their losses. More conservative traders can wait for prices to close above the five-day simple moving average, currently about 0.30 above the price. This will allow prices to demonstrate the potential change in trend before initiating a long position. |
Mike Carr, CMT, is a member of the Market Technicians Association, and editor of the MTA's newsletter, Technically Speaking. He is also the author of "Smarter Investing in Any Economy: The Definitive Guide to Relative Strength Investing," and "Conquering the Divide: How to Use Economic Indicators to Catch Stock Market Trends."
| Website: | www.moneynews.com/blogs/MichaelCarr/id-73 |
| E-mail address: | marketstrategist@gmail.com |
Click here for more information about our publications!
PRINT THIS ARTICLE

Request Information From Our Sponsors
- StockCharts.com, Inc.
- Candle Patterns
- Candlestick Charting Explained
- Intermarket Technical Analysis
- John Murphy on Chart Analysis
- John Murphy's Chart Pattern Recognition
- John Murphy's Market Message
- MurphyExplainsMarketAnalysis-Intermarket Analysis
- MurphyExplainsMarketAnalysis-Visual Analysis
- StockCharts.com
- Technical Analysis of the Financial Markets
- The Visual Investor
- VectorVest, Inc.
- Executive Premier Workshop
- One-Day Options Course
- OptionsPro
- Retirement Income Workshop
- Sure-Fire Trading Systems (VectorVest, Inc.)
- Trading as a Business Workshop
- VectorVest 7 EOD
- VectorVest 7 RealTime/IntraDay
- VectorVest AutoTester
- VectorVest Educational Services
- VectorVest OnLine
- VectorVest Options Analyzer
- VectorVest ProGraphics v6.0
- VectorVest ProTrader 7
- VectorVest RealTime Derby Tool
- VectorVest Simulator
- VectorVest Variator
- VectorVest Watchdog
