HOT TOPICS LIST
- MACD
- Fibonacci
- RSI
- Gann
- ADXR
- Stochastics
- Volume
- Triangles
- Futures
- Cycles
- Volatility
- ZIGZAG
- MESA
- Retracement
- Aroon
INDICATORS LIST
LIST OF TOPICS
PRINT THIS ARTICLE
by James Kupfer
Safeguard Scientific may be in a position for a speculative purchase.
Position: Buy
James Kupfer
Mr. Kupfer is a market professional and amateur stock market commentator. Disclosure: It is likely that Mr. Kupfer has or will enter a position in any security he writes about.
PRINT THIS ARTICLE
TREND-CHANNEL
Speculating On Safeguard Scientific
07/10/08 02:20:00 PMby James Kupfer
Safeguard Scientific may be in a position for a speculative purchase.
Position: Buy
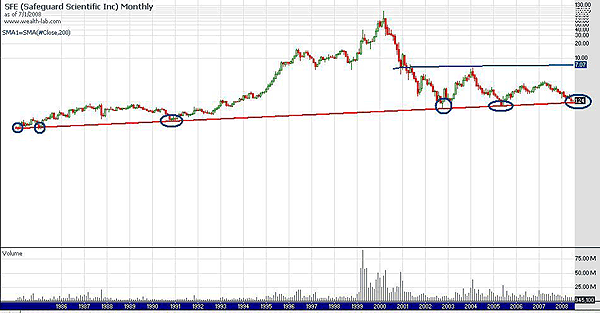
| A valid trendline is composed of at least three instances where the lows or closes on a stock can be joined by a line. Looking at Figure 1, a monthly chart for Safeguard Scientific (SFE), you can see that a valid trendline has been in existence since 1990. After rising to nearly $100 on a split-adjusted basis in the dotcom boom, SFE has fallen back to below $2. |

|
| FIGURE 1: SFE, MONTHLY. A valid trendline has been in existence since 1990. |
| Graphic provided by: Wealth-Lab. |
| |
| In 2002 and 2005, the stock touched and subsequently bounced off the old trendline, again supporting its validity. Currently, SFE is again poised to touch its old trendline, with the price at $1.20. |
| Be aware that this is a speculative play, and even if the stock bounces, it won't likely bounce more than a few dimes. Regardless, this trendline bears watching because if SFE breaks through, it would likely be in a good position to short. |
Mr. Kupfer is a market professional and amateur stock market commentator. Disclosure: It is likely that Mr. Kupfer has or will enter a position in any security he writes about.
Click here for more information about our publications!
PRINT THIS ARTICLE

Request Information From Our Sponsors
- StockCharts.com, Inc.
- Candle Patterns
- Candlestick Charting Explained
- Intermarket Technical Analysis
- John Murphy on Chart Analysis
- John Murphy's Chart Pattern Recognition
- John Murphy's Market Message
- MurphyExplainsMarketAnalysis-Intermarket Analysis
- MurphyExplainsMarketAnalysis-Visual Analysis
- StockCharts.com
- Technical Analysis of the Financial Markets
- The Visual Investor
- VectorVest, Inc.
- Executive Premier Workshop
- One-Day Options Course
- OptionsPro
- Retirement Income Workshop
- Sure-Fire Trading Systems (VectorVest, Inc.)
- Trading as a Business Workshop
- VectorVest 7 EOD
- VectorVest 7 RealTime/IntraDay
- VectorVest AutoTester
- VectorVest Educational Services
- VectorVest OnLine
- VectorVest Options Analyzer
- VectorVest ProGraphics v6.0
- VectorVest ProTrader 7
- VectorVest RealTime Derby Tool
- VectorVest Simulator
- VectorVest Variator
- VectorVest Watchdog
