HOT TOPICS LIST
- MACD
- Fibonacci
- RSI
- Gann
- ADXR
- Stochastics
- Volume
- Triangles
- Futures
- Cycles
- Volatility
- ZIGZAG
- MESA
- Retracement
- Aroon
INDICATORS LIST
LIST OF TOPICS
PRINT THIS ARTICLE
by James Kupfer
After a strong upward move over the last few months, is BIG in a position to short?
Position: Sell
James Kupfer
Mr. Kupfer is a market professional and amateur stock market commentator. Disclosure: It is likely that Mr. Kupfer has or will enter a position in any security he writes about.
PRINT THIS ARTICLE
FIBONACCI
A Big Short On Big Lots
07/09/08 09:27:46 AMby James Kupfer
After a strong upward move over the last few months, is BIG in a position to short?
Position: Sell
| For the last few months, shares of Big Lots (BIG) have been moving strongly upward. Now, however, they may have reached a level where you should consider selling existing holdings and possibly initiating a short position. |
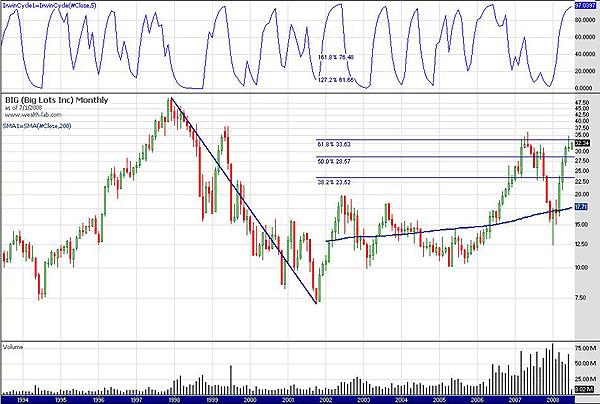
| Looking at Figure 1, the monthly chart, you can see a few things of importance. First, BIG is at the 61.8% Fibonacci retracement level drawn in this instance by taking 61.8% of the difference between the stock's all-time high and its subsequent low. The stock last topped at this same level, which also provides a significant resistance level to further upward movement. Finally, the Irwin stochastic indicator is significantly overbought. |

|
| FIGURE 1: BIG, MONTHLY. This stock is at the 61.8% Fibonacci retracement level. |
| Graphic provided by: Wealth-Lab. |
| |
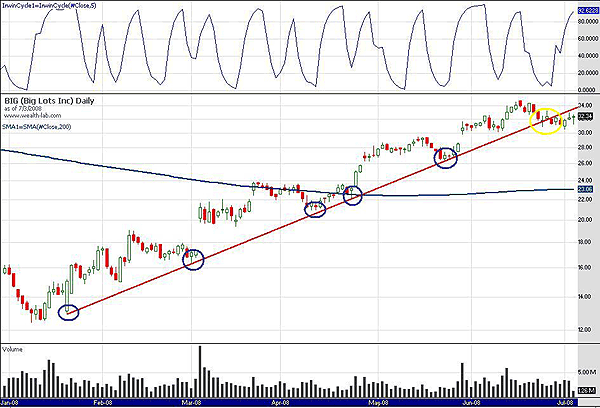
| Moving to the daily time frame (Figure 2), you can see more indicators that the stock may be ready to begin a downward path. First, drawing a trendline between all the recent lows of the stock, you can see five previous instances where BIG has bounced off the trendline.Three points is commonly thought to constitute and validate a trendline. Within the last two weeks, BIG has decisively broken through the trendline, indicating a possible change in direction whereby the old trendline now becomes a resistance line. Further, the Irwin Indicator is overbought. |

|
| FIGURE 2: BIG, DAILY. Is the stock ready to begin a downward path? |
| Graphic provided by: Wealth-Lab. |
| |
| A rise in the broad markets may carry this stock with it at least temporarily, but this seems to be a good opportunity in which to short BIG. Stops should be placed somewhere above the June or 2007 highs. |
Mr. Kupfer is a market professional and amateur stock market commentator. Disclosure: It is likely that Mr. Kupfer has or will enter a position in any security he writes about.
Click here for more information about our publications!
PRINT THIS ARTICLE

Request Information From Our Sponsors
- VectorVest, Inc.
- Executive Premier Workshop
- One-Day Options Course
- OptionsPro
- Retirement Income Workshop
- Sure-Fire Trading Systems (VectorVest, Inc.)
- Trading as a Business Workshop
- VectorVest 7 EOD
- VectorVest 7 RealTime/IntraDay
- VectorVest AutoTester
- VectorVest Educational Services
- VectorVest OnLine
- VectorVest Options Analyzer
- VectorVest ProGraphics v6.0
- VectorVest ProTrader 7
- VectorVest RealTime Derby Tool
- VectorVest Simulator
- VectorVest Variator
- VectorVest Watchdog
- StockCharts.com, Inc.
- Candle Patterns
- Candlestick Charting Explained
- Intermarket Technical Analysis
- John Murphy on Chart Analysis
- John Murphy's Chart Pattern Recognition
- John Murphy's Market Message
- MurphyExplainsMarketAnalysis-Intermarket Analysis
- MurphyExplainsMarketAnalysis-Visual Analysis
- StockCharts.com
- Technical Analysis of the Financial Markets
- The Visual Investor
