HOT TOPICS LIST
- MACD
- Fibonacci
- RSI
- Gann
- ADXR
- Stochastics
- Volume
- Triangles
- Futures
- Cycles
- Volatility
- ZIGZAG
- MESA
- Retracement
- Aroon
INDICATORS LIST
LIST OF TOPICS
PRINT THIS ARTICLE
by Koos van der Merwe
Yes--I would love to own a Mercedes Benz, but...
Position: Accumulate
Koos van der Merwe
Has been a technical analyst since 1969, and has worked as a futures and options trader with First Financial Futures in Johannesburg, South Africa.
PRINT THIS ARTICLE
HEAD & SHOULDERS
Is It Time To Look At Daimler?
07/09/08 11:41:32 AMby Koos van der Merwe
Yes--I would love to own a Mercedes Benz, but...
Position: Accumulate
| ...Would I buy the shares? We all know what happened when Daimler bought Chrysler. Catastrophe. Daimler never had a Lee Iacocca, an American businessman who in the 1980s revived an ailing Chrysler. His success with Chrysler, and the book he wrote about his management techniques, became an entrepreneurial inspiration. |

|
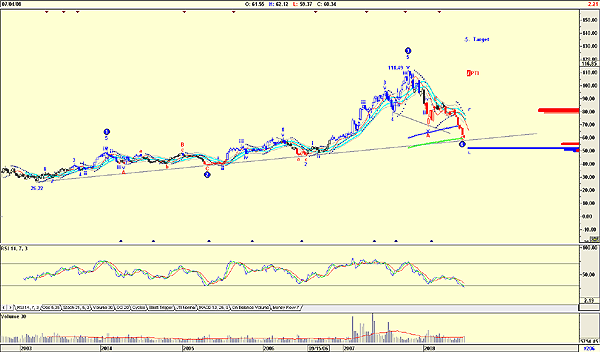
| FIGURE 1: DAIMLER, WEEKLY. Here's a weekly chart of Daimler AG showing a long-term support line. |
| Graphic provided by: AdvancedGET. |
| |
| Figure 1, a weekly chart of Daimler, shows how the stock price rose from $26.22 in February 2003 to a high of $111.49 in October 2007, and this in spite of the drag that Chrysler had on the company. On May 15, 2007, Daimler offloaded Chrysler to private equity group Cerberus Capital. Daimler AG received $8.9 billion from Cerberus for 80.1% of the company, a far cry from the $43 billion it shelled out to acquire the company back in 1998. However, the deal was far more convoluted, because the money received by Daimler actually goes to paying off Chrysler's outstanding loans, ensuring the new Chrysler holding company begins its new life debt-free. |

|
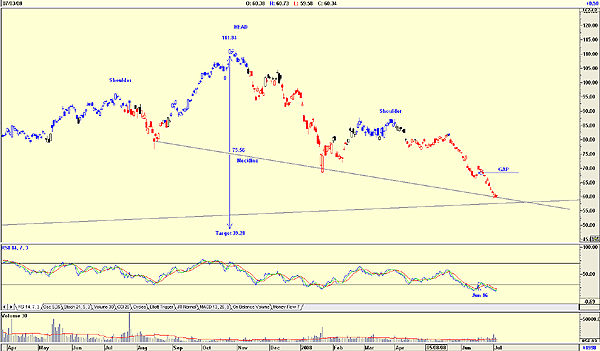
| FIGURE 2: DAIMLER, DAILY. Here's a daily chart showing a head & shoulder formation with a possible target. |
| Graphic provided by: AdvancedGET. |
| |
| Was the collapse from the high in October the result of the deal? Probably. As investors became aware that Daimler virtually wrote off $43 billion from its balance sheet, they sold the stock, pushing it down to the present price of $60.34. As you can see on the weekly chart, the price is close to finding support on the long-term trendline. The chart also suggests an Elliott wave count (wave 4) as completed, with a bullish wave 5 to follow. This is confirmed by the relative strength index (RSI), which although oversold has not yet given a buy signal. Volume is rising as the price falls, suggesting further weakness, but for how much longer? Finally, the PTI has a value of 7. Anything less than 32 suggests that the fifth-wave target shown on the chart will not be reached. |
| Figure 2, the daily chart, shows a massive head & shoulder formation (Elliott wave 3-4-5-A-B-C ) with the current price testing the neckline. Should it break through, the target is $39.28. What is disconcerting is the RS gave a failed buy signal on June 16, and on a rising gap in the price movement with an increase in volume, all showed bullish signs, but ended up a failure. With the present low in the RSI, it is doubtful that a divergence buy signal could be given. Daimler AG is a company well known for its product. Unfortunately, with the current price of gas as high as it is, buyers are looking to cars that are more energy-efficient. Is this chart suggesting that Daimler may soon be offering a far more fuel-efficient car to the consumer, or is it simply that the company now has a clean balance sheet after the disastrous Chrysler merger, and is once more a company that we should hold in a portfolio? Whatever the reason, the share is now on my watchlist. |
Has been a technical analyst since 1969, and has worked as a futures and options trader with First Financial Futures in Johannesburg, South Africa.
| Address: | 3256 West 24th Ave |
| Vancouver, BC | |
| Phone # for sales: | 6042634214 |
| E-mail address: | petroosp@gmail.com |
Click here for more information about our publications!
PRINT THIS ARTICLE

Request Information From Our Sponsors
- StockCharts.com, Inc.
- Candle Patterns
- Candlestick Charting Explained
- Intermarket Technical Analysis
- John Murphy on Chart Analysis
- John Murphy's Chart Pattern Recognition
- John Murphy's Market Message
- MurphyExplainsMarketAnalysis-Intermarket Analysis
- MurphyExplainsMarketAnalysis-Visual Analysis
- StockCharts.com
- Technical Analysis of the Financial Markets
- The Visual Investor
- VectorVest, Inc.
- Executive Premier Workshop
- One-Day Options Course
- OptionsPro
- Retirement Income Workshop
- Sure-Fire Trading Systems (VectorVest, Inc.)
- Trading as a Business Workshop
- VectorVest 7 EOD
- VectorVest 7 RealTime/IntraDay
- VectorVest AutoTester
- VectorVest Educational Services
- VectorVest OnLine
- VectorVest Options Analyzer
- VectorVest ProGraphics v6.0
- VectorVest ProTrader 7
- VectorVest RealTime Derby Tool
- VectorVest Simulator
- VectorVest Variator
- VectorVest Watchdog
