HOT TOPICS LIST
- MACD
- Fibonacci
- RSI
- Gann
- ADXR
- Stochastics
- Volume
- Triangles
- Futures
- Cycles
- Volatility
- ZIGZAG
- MESA
- Retracement
- Aroon
INDICATORS LIST
LIST OF TOPICS
PRINT THIS ARTICLE
by Dennis D. Peterson
Volume tells us how many shares are traded and thus gives us a measure of buying and selling enthusiasm.
Position: N/A
Dennis D. Peterson
Market index trading on a daily basis.
PRINT THIS ARTICLE
VOLUME
Volume Analysis (Part IV of IV)
05/21/01 03:55:43 PMby Dennis D. Peterson
Volume tells us how many shares are traded and thus gives us a measure of buying and selling enthusiasm.
Position: N/A
| While it's necessary to be aware of demand versus scarcity to explain tops and bottoms, it's still helpful to think of volume as a measurement of enthusiasm. |
| Suppose you were to compare today's enthusiasm for price increases or decreases with the enthusiasm from the recent past. For example, if prices are in an upswing that is part of an overall uptrend, then obviously the equity costs more now than it did previously. Looking at the previous upswing, how enthusiastic is today's buying compared to the buying of the most recent past upswing? When I start comparing two different time frames, I am on the path to creating a momentum indicator. |

|
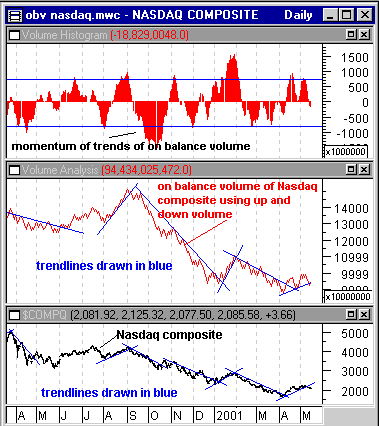
| Figure 1: Nasdaq composite daily prices (bottom chart), on balance volume (OBV) of Nasdaq (middle chart), and momentum of OBV trends (top chart). |
| Graphic provided by: MetaStock. |
| Graphic provided by: Data vendor: eSignal<. |
| |
| To create a measure of volume momentum for the Nasdaq composite, calculate a running summation of the Nasdaq daily up and down volume. If today's close was greater than yesterday's close, put both the up and down volume in the sum. If today's close was less than yesterday's, subtract the up and down volume from the sum. This is equivalent to calculating the on-balance volume (OBV) of the Nasdaq composite. The running sum is seen in the middle chart. I next drew trendlines on the OBV of the Nasdaq, and then on the Nasdaq composite. I want to determine if the enthusiasm of the current upswing is comparable to those in the past. By going back in time I can also see how previous upswings in prices increased with previous enthusiasm. It's clear that the current upswing doesn't have the enthusiasm of those in the past. Since I am comparing trends, I then built the MACD histogram of the OBV of the Nasdaq (top chart). This only provides a different visualization of the middle chart - no new information is added. I went even further and built the RSI of the Nasdaq OBV. One look at the chart and I could see all the problems with using RSI, so I immediately built the StochRSI (Stochastic RSI) and traded it for long positions, only to further verify my visual analysis. It did what I wanted, making money going up to the Nasdaq peak of March 2000, and then hanging onto it. This served to confirm that the momentum of the trends of Nasdaq OBV is a valid observation. The market has become neutral at the current prices. News reports tend to put a spin on the news to match market performance on a specific day. But I see a market that makes telltale moves that are often recognizable as in-gear or out-of-gear. I watch for bear and bull traps, and their absence tells me that the market is neutral. The current upswing doesn't have the enthusiasm of those in the past and is therefore subject to weakening, but given the market neutrality not a whole lot. When the market can't make up its mind, it's time to sit on the sidelines and wait it out. Let the market tell you what's going on. |
Market index trading on a daily basis.
| Title: | Staff Writer |
| Company: | Technical Analysis, Inc. |
| Address: | 4757 California Ave SW |
| Seattle, WA 98116-4499 | |
| Phone # for sales: | 206 938 0570 |
| Fax: | 206 938 1307 |
| Website: | www.traders.com |
| E-mail address: | dpeterson@traders.com |
Traders' Resource Links | |
| Charting the Stock Market: The Wyckoff Method -- Books | |
| Working-Money.com -- Online Trading Services | |
| Traders.com Advantage -- Online Trading Services | |
| Technical Analysis of Stocks & Commodities -- Publications and Newsletters | |
| Working Money, at Working-Money.com -- Publications and Newsletters | |
| Traders.com Advantage -- Publications and Newsletters | |
| Professional Traders Starter Kit -- Software | |
Click here for more information about our publications!
Comments
Date: 05/22/01Rank: 5Comment: Nice series, Dennis
Date: 05/22/01Rank: 4Comment:
Date: 05/23/01Rank: Comment: Dear Mr. Peterson: Your articles on Volume Analysis for stocks are very interesting.I found them easy to read and understand.How about writing some articles on volume,open interest,and prices on futures? Neil McLaughlin,nmcl@erols.com
Date: 05/30/01Rank: 5Comment:

Request Information From Our Sponsors
- StockCharts.com, Inc.
- Candle Patterns
- Candlestick Charting Explained
- Intermarket Technical Analysis
- John Murphy on Chart Analysis
- John Murphy's Chart Pattern Recognition
- John Murphy's Market Message
- MurphyExplainsMarketAnalysis-Intermarket Analysis
- MurphyExplainsMarketAnalysis-Visual Analysis
- StockCharts.com
- Technical Analysis of the Financial Markets
- The Visual Investor
- VectorVest, Inc.
- Executive Premier Workshop
- One-Day Options Course
- OptionsPro
- Retirement Income Workshop
- Sure-Fire Trading Systems (VectorVest, Inc.)
- Trading as a Business Workshop
- VectorVest 7 EOD
- VectorVest 7 RealTime/IntraDay
- VectorVest AutoTester
- VectorVest Educational Services
- VectorVest OnLine
- VectorVest Options Analyzer
- VectorVest ProGraphics v6.0
- VectorVest ProTrader 7
- VectorVest RealTime Derby Tool
- VectorVest Simulator
- VectorVest Variator
- VectorVest Watchdog
