HOT TOPICS LIST
- MACD
- Fibonacci
- RSI
- Gann
- ADXR
- Stochastics
- Volume
- Triangles
- Futures
- Cycles
- Volatility
- ZIGZAG
- MESA
- Retracement
- Aroon
INDICATORS LIST
LIST OF TOPICS
PRINT THIS ARTICLE
by Alan R. Northam
XLB has been in a long-term uptrend since 2002 but may be getting ready to reverse its trend. A symmetrical triangle has formed on the daily chart and has signaled a trend reversal.
Position: N/A
Alan R. Northam
Alan Northam lives in the Dallas, Texas area and as an electronic engineer gave him an analytical mind from which he has developed a thorough knowledge of stock market technical analysis. His abilities to analyze the future direction of the stock market has allowed him to successfully trade of his own portfolio over the last 30 years. Mr. Northam is now retired and trading the stock market full time. You can reach him at inquiry@tradersclassroom.com or by visiting his website at http://www.tradersclassroom.com. You can also follow him on Twitter @TradersClassrm.
PRINT THIS ARTICLE
TRIANGLES
Material Select SPDR Trend Reversal
07/09/08 09:08:09 AMby Alan R. Northam
XLB has been in a long-term uptrend since 2002 but may be getting ready to reverse its trend. A symmetrical triangle has formed on the daily chart and has signaled a trend reversal.
Position: N/A
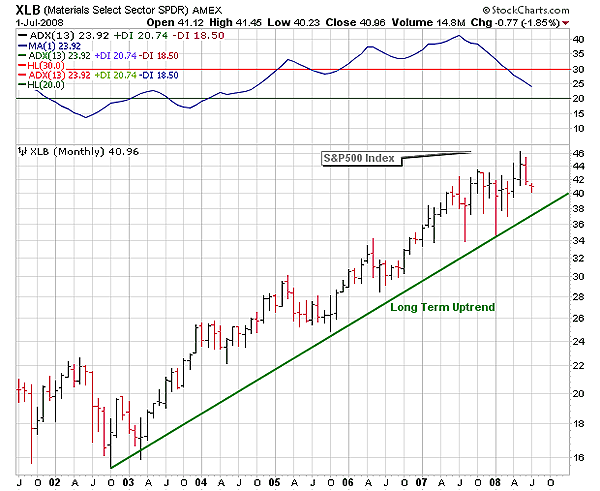
| Figure 1 is that of a monthly bar chart for XLB. It shows the XLB has been in a long-term upward trend since 2002. All along its upward journey it has made a series of higher highs and higher lows, as is normal when markets are trending in an upward direction. Recently, XLB has made a new higher high and is in the process of a market correction as it moves downward toward its long-term trendline. Up until now, every time that XLB entered into a market correction it resulted in a new higher low followed by another rally to new highs. Will XLB break through the long-term trendline and establish itself in a new downtrend? For reference I have added the Standard & Poor's 500 in gray to show that the index, which XLB is a part of, peaked in 2007 and is now in an established downtrend. I also want to draw your attention to the average directional movement index (ADX) just above the price chart. This index moves higher as the momentum of the trend increases and moves lower as the market slows down. Note that the ADX peaked in mid-2007, indicating that XLB has lost its momentum and is now starting to slow down. A normal occurrence in a market that is getting ready to reverse its trend is a loss of momentum. However, a loss of momentum does not mean that a market must reverse its trend. Thus, we have two pieces of evidence that XLB could be about to reverse its trend. First, the S&P 500 has already reversed its trend, and second, XLB has lost its upward momentum and is starting to slow down. |

|
| FIGURE 1: XLB, MONTHLY. Here's the monthly price chart of XLB showing a long-term trendline and the ADX above the price chart. |
| Graphic provided by: StockCharts.com. |
| |
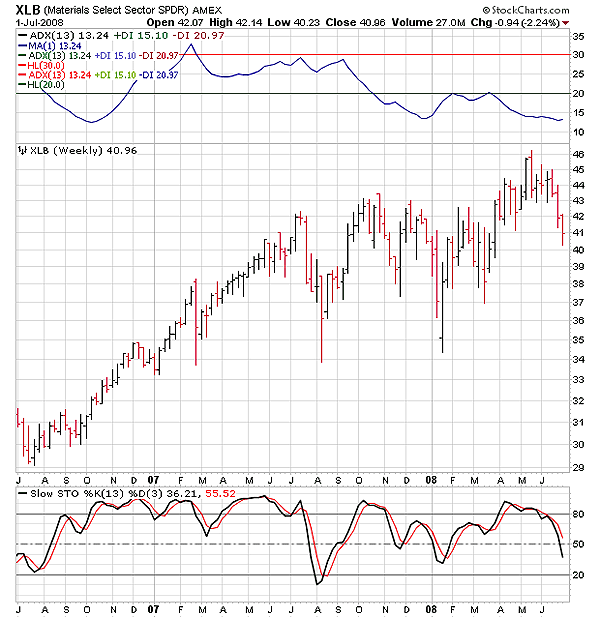
| Figure 2 is a weekly bar chart of XLB. It also shows that XLB remains in an upward trend but that over the last several weeks it has been in a market correction that has not yet reversed itself. Again, I have shown the ADX above the price chart. Note that in October 2007, the ADX dropped below its 20 line. This is an indication that XLB is no longer in an uptrend even though price continues to drift higher. When the ADX is below the 20 level, market technicians no longer gauge a market's progress by using trend-following indicators but rely upon oscillator indicators to gauge the activity of a market. Oscillators are normally used in range-bound markets. Therefore, I have added the slow stochastic indicator below the price chart so we can measure the activity of this market on a weekly basis. The stochastic has recently fallen below its 50 line, indicating that market sellers have taken control of this market. As a result, we should expect to see this market continue to move lower in the weeks ahead. We now have more evidence that XLB could be on the verge of changing the direction of its trend. Our third piece of evidence is that XLB is no longer in an established upward trend on a weekly basis and is merely drifting higher, which should stop when XLB runs out of momentum. And our fourth piece of evidence is that this market is now being controlled by market sellers. |

|
| FIGURE 2: XLB, WEEKLY. Here's the weekly price chart of XLB showing the ADX above the price chart and the slow stochastic indicator below. |
| Graphic provided by: StockCharts.com. |
| |
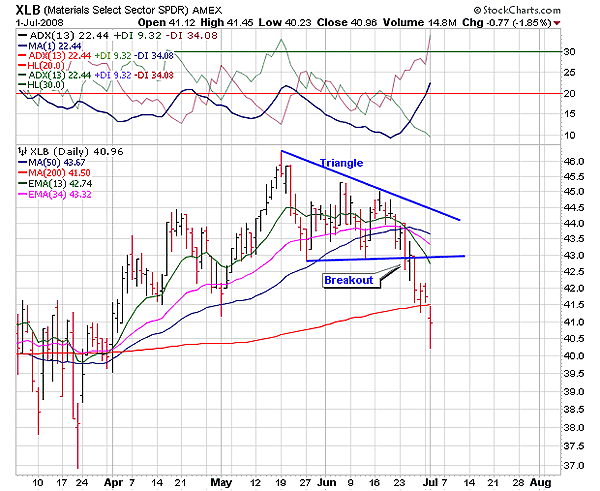
| Figure 3 is a daily price bar chart of XLB. This chart shows that XLB put in a market top in mid-May and formed a symmetrical triangle during the following month. Triangle patterns are normally continuation patterns and in an uptrend the market normally breaks out to the upside. However, when the market breaks out to the downside, as has happened with XLB, the symmetrical triangle pattern becomes a reversal signal. Note that once XLB broke out to the downside, it continued to sell off until it hit its 200-day moving average. For three days, this moving average acted as support for the market, but then XLB broke down below the 200-day moving average, indicating that this market wants to continue to move lower. A break below the 200-day moving average spells trouble to a bull market, and when the 50-day moving average crosses below the 200-day moving average doom comes to a bull market. So right now it looks like the bull market is in trouble. I have again shown the ADX above the price chart. Note that ADX has moved above its 20 line. This is an indication that the downward price breakout is picking up momentum. If ADX continues to move upward and moves above its 30 line, that will be an indication that a strong downtrend has been established. The fifth piece of evidence that XLB could be changing the direction of its trend is that the market has broken out to the downside of a symmetrical triangle, signaling a reversal in trend. And the last piece of evidence is that momentum to the downside is starting to pick up. |

|
| FIGURE 3: XLB, DAILY. Here's the daily price chart showing a symmetrical triangle and the ADX above the price chart. |
| Graphic provided by: StockCharts.com. |
| |
| Although the long-term trend in XLB remains in effect, all the evidence of the monthly, weekly, and daily price charts show that XLB could be in the process of changing its trend from up to down. What we need to watch at this point is the 50-day moving average. If the 50-day moving average moves below the 200-day moving average, that will most likely seal the fate of the bull market in XLB. As a trader, I am not quite ready to short this exchange traded fund (ETF) but will continue to watch it. I expect this market to bounce and retest the underside resistance of the symmetrical triangle. If this resistance holds and the market then starts to move back down, I will consider a short position in XLB. From a more conservative trading opportunity I would wait for the 50-day moving average to cross below the 200-day moving average, followed by a retest of resistance of the 50-day moving average. |
Alan Northam lives in the Dallas, Texas area and as an electronic engineer gave him an analytical mind from which he has developed a thorough knowledge of stock market technical analysis. His abilities to analyze the future direction of the stock market has allowed him to successfully trade of his own portfolio over the last 30 years. Mr. Northam is now retired and trading the stock market full time. You can reach him at inquiry@tradersclassroom.com or by visiting his website at http://www.tradersclassroom.com. You can also follow him on Twitter @TradersClassrm.
| Garland, Tx | |
| Website: | www.tradersclassroom.com |
| E-mail address: | inquiry@tradersclassroom.com |
Click here for more information about our publications!
Comments
Date: 07/11/08Rank: 5Comment:

Request Information From Our Sponsors
- StockCharts.com, Inc.
- Candle Patterns
- Candlestick Charting Explained
- Intermarket Technical Analysis
- John Murphy on Chart Analysis
- John Murphy's Chart Pattern Recognition
- John Murphy's Market Message
- MurphyExplainsMarketAnalysis-Intermarket Analysis
- MurphyExplainsMarketAnalysis-Visual Analysis
- StockCharts.com
- Technical Analysis of the Financial Markets
- The Visual Investor
- VectorVest, Inc.
- Executive Premier Workshop
- One-Day Options Course
- OptionsPro
- Retirement Income Workshop
- Sure-Fire Trading Systems (VectorVest, Inc.)
- Trading as a Business Workshop
- VectorVest 7 EOD
- VectorVest 7 RealTime/IntraDay
- VectorVest AutoTester
- VectorVest Educational Services
- VectorVest OnLine
- VectorVest Options Analyzer
- VectorVest ProGraphics v6.0
- VectorVest ProTrader 7
- VectorVest RealTime Derby Tool
- VectorVest Simulator
- VectorVest Variator
- VectorVest Watchdog
