HOT TOPICS LIST
- MACD
- Fibonacci
- RSI
- Gann
- ADXR
- Stochastics
- Volume
- Triangles
- Futures
- Cycles
- Volatility
- ZIGZAG
- MESA
- Retracement
- Aroon
INDICATORS LIST
LIST OF TOPICS
PRINT THIS ARTICLE
by James Kupfer
If the price of CNH drops a bit more, it may be in a good position for an intermediate-term bounce.
Position: Buy
James Kupfer
Mr. Kupfer is a market professional and amateur stock market commentator. Disclosure: It is likely that Mr. Kupfer has or will enter a position in any security he writes about.
PRINT THIS ARTICLE
SPEED LINES
Is CNH Global Ready To Bounce?
07/07/08 01:37:38 PMby James Kupfer
If the price of CNH drops a bit more, it may be in a good position for an intermediate-term bounce.
Position: Buy
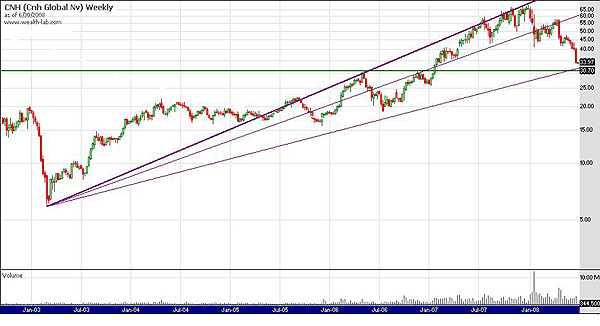
| Take a look at a weekly chart on CNH Global (CNH) and you can see that despite a long uptrend starting in the beginning of 2003, the stock has dropped more than 50% from its 52-week high of $70. Is it now ready for a bounce? A convergence of price supporting indicators leads to the conclusion that a bounce may be approaching. |

|
| FIGURE 1: CNH, WEEKLY. Despite a long uptrend starting in 2003, this stock has dropped more than 50% from its 52-week high of $70. Is it ready for a bounce? |
| Graphic provided by: Wealth-lab. |
| |
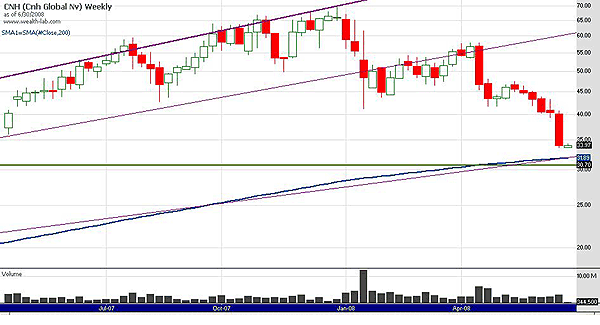
| First, looking at the weekly chart in Figure 1, you can see a speed resistance line (SLR) drawn from the start of the uptrend in 2003 to the stock's recent high of $70. SLRs are drawn at one third and two thirds of the stock's price action and indicate support and resistance levels. Looking at the closeup chart in Figure 2, you can see that CNH is approaching support of the SLR (purple line) at about $32. |

|
| FIGURE 2: CNH, WEEKLY. This chart shows that CNH is approaching support of the SLR (purple line) at about $32. |
| Graphic provided by: Wealth-Lab. |
| |
| Second, note that the 200-period moving average in blue is overlapping the SLR so they are almost indistinguishable on the chart. The 200-period moving average is commonly assumed to provide support/resistance to prices. Finally, there is a long-term price support (green line) at $30.70, which can best be seen in Figure 1. |
| CNH is currently about $1 away from the SLR and 200-period moving average prices. I have an order to buy CNH at $32.00 with a stop below the green support line at $30.70, but your exact entry and exit points are of course a matter of your preference and risk tolerance. |
Mr. Kupfer is a market professional and amateur stock market commentator. Disclosure: It is likely that Mr. Kupfer has or will enter a position in any security he writes about.
Click here for more information about our publications!
PRINT THIS ARTICLE

Request Information From Our Sponsors
- StockCharts.com, Inc.
- Candle Patterns
- Candlestick Charting Explained
- Intermarket Technical Analysis
- John Murphy on Chart Analysis
- John Murphy's Chart Pattern Recognition
- John Murphy's Market Message
- MurphyExplainsMarketAnalysis-Intermarket Analysis
- MurphyExplainsMarketAnalysis-Visual Analysis
- StockCharts.com
- Technical Analysis of the Financial Markets
- The Visual Investor
- VectorVest, Inc.
- Executive Premier Workshop
- One-Day Options Course
- OptionsPro
- Retirement Income Workshop
- Sure-Fire Trading Systems (VectorVest, Inc.)
- Trading as a Business Workshop
- VectorVest 7 EOD
- VectorVest 7 RealTime/IntraDay
- VectorVest AutoTester
- VectorVest Educational Services
- VectorVest OnLine
- VectorVest Options Analyzer
- VectorVest ProGraphics v6.0
- VectorVest ProTrader 7
- VectorVest RealTime Derby Tool
- VectorVest Simulator
- VectorVest Variator
- VectorVest Watchdog
