HOT TOPICS LIST
- MACD
- Fibonacci
- RSI
- Gann
- ADXR
- Stochastics
- Volume
- Triangles
- Futures
- Cycles
- Volatility
- ZIGZAG
- MESA
- Retracement
- Aroon
INDICATORS LIST
LIST OF TOPICS
PRINT THIS ARTICLE
by Mike Carr, CMT
While news reports tell us how bad things are, the fact is provided without context. We need to look at what came before and after June 1930 to decide if we can draw any conclusion from this sound bite.
Position: N/A
Mike Carr, CMT
Mike Carr, CMT, is a member of the Market Technicians Association, and editor of the MTA's newsletter, Technically Speaking. He is also the author of "Smarter Investing in Any Economy: The Definitive Guide to Relative Strength Investing," and "Conquering the Divide: How to Use Economic Indicators to Catch Stock Market Trends."
PRINT THIS ARTICLE
NOVICE TRADER NOTE
The Worst June Since 1930
07/07/08 01:27:42 PMby Mike Carr, CMT
While news reports tell us how bad things are, the fact is provided without context. We need to look at what came before and after June 1930 to decide if we can draw any conclusion from this sound bite.
Position: N/A
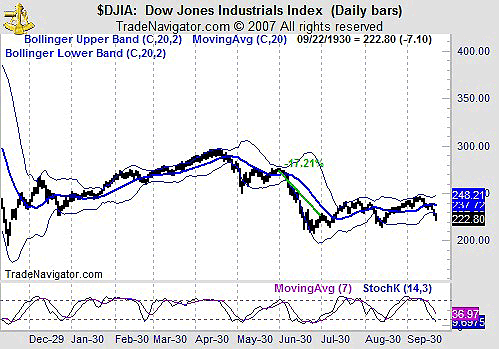
| The Dow Jones Industrial Average (DJIA) fell more than 10% in June, and television analysts were pointing out that it was the worst June since 1930. While correct, there are major differences between 1930 and 2008. In 1930, the DJIA fell by more than 17% as the first significant rally since the 1929 crash. Economically, the Great Depression was closer to a beginning than an end, and the Federal Reserve was tightening the money supply as the economy contracted. |
| Today, the macroeconomic conditions are vastly different from 1930. There is a debate as to whether the economy is even in a recession, let alone a depression. The market peaked in 2000, eight years ago rather than only months ago as in 1930. And the Federal Reserve is generally accommodative, with most measures of money supply showing at least modest growth. |
| The charts are also much different. In 1930 (Figure 1), volatility increased as the June decline accelerated and stochastics gave a bullish crossover buy signal from oversold extremes at the end of the month. A brief rally followed before the bear market resumed and ultimately bottomed in 1932. |

|
| FIGURE 1: DJIA, DAILY. Already in a bear market, the decline in June 1930 was 17.21% as the post-crash rally failed. |
| Graphic provided by: Trade Navigator. |
| |
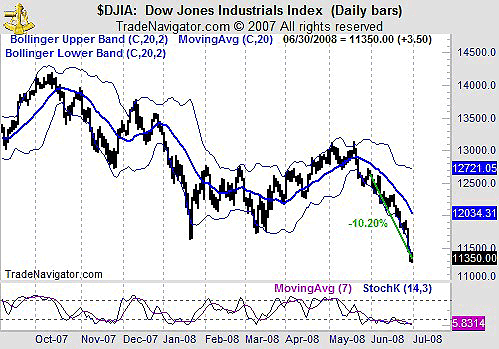
| Today (Figure 2), volatility has increased but momentum has not yet signaled a buy. While June may have marked a selling climax in the market, the chart shows no sign that selling pressures have abated. |

|
| FIGURE 2: DJIA, DAILY. While declining since October 2007, the market is nowhere near the oversold extremes seen in 1930. |
| Graphic provided by: Trade Navigator. |
| |
| With the economy vastly different today than it was 78 years ago, there is no reason to assume that the market has any relationship with its behavior in 1930. This is another example of how difficult it can be to make money by listening to pundits on CNBC. |
Mike Carr, CMT, is a member of the Market Technicians Association, and editor of the MTA's newsletter, Technically Speaking. He is also the author of "Smarter Investing in Any Economy: The Definitive Guide to Relative Strength Investing," and "Conquering the Divide: How to Use Economic Indicators to Catch Stock Market Trends."
| Website: | www.moneynews.com/blogs/MichaelCarr/id-73 |
| E-mail address: | marketstrategist@gmail.com |
Click here for more information about our publications!
PRINT THIS ARTICLE

Request Information From Our Sponsors
- StockCharts.com, Inc.
- Candle Patterns
- Candlestick Charting Explained
- Intermarket Technical Analysis
- John Murphy on Chart Analysis
- John Murphy's Chart Pattern Recognition
- John Murphy's Market Message
- MurphyExplainsMarketAnalysis-Intermarket Analysis
- MurphyExplainsMarketAnalysis-Visual Analysis
- StockCharts.com
- Technical Analysis of the Financial Markets
- The Visual Investor
- VectorVest, Inc.
- Executive Premier Workshop
- One-Day Options Course
- OptionsPro
- Retirement Income Workshop
- Sure-Fire Trading Systems (VectorVest, Inc.)
- Trading as a Business Workshop
- VectorVest 7 EOD
- VectorVest 7 RealTime/IntraDay
- VectorVest AutoTester
- VectorVest Educational Services
- VectorVest OnLine
- VectorVest Options Analyzer
- VectorVest ProGraphics v6.0
- VectorVest ProTrader 7
- VectorVest RealTime Derby Tool
- VectorVest Simulator
- VectorVest Variator
- VectorVest Watchdog
