

HOT TOPICS LIST
- MACD
- Fibonacci
- RSI
- Gann
- ADXR
- Stochastics
- Volume
- Triangles
- Futures
- Cycles
- Volatility
- ZIGZAG
- MESA
- Retracement
- Aroon
INDICATORS LIST
LIST OF TOPICS
PRINT THIS ARTICLE
by Koos van der Merwe
The DJIA is officially in a recession but the S&P/TSX Composite index of Canada is not, mainly due to the price of oil and gold. Today's teenagers have yet to find this out. Aeropostale is an example.
Position: Accumulate
Koos van der Merwe
Has been a technical analyst since 1969, and has worked as a futures and options trader with First Financial Futures in Johannesburg, South Africa.
PRINT THIS ARTICLE
OSCILLATORS
Aeropostale, A Shop For The Teens
06/30/08 01:33:05 PMby Koos van der Merwe
The DJIA is officially in a recession but the S&P/TSX Composite index of Canada is not, mainly due to the price of oil and gold. Today's teenagers have yet to find this out. Aeropostale is an example.
Position: Accumulate
| Aeropostale is a mall-based specialty retailer of casual apparel and accessories, principally targeting 14- to 17-year-old young women and men. The company provides customers with a focused selection of high-quality, active-oriented, fashion and fashion basic merchandise at compelling values. The company currently operates more than 800 Aeropostale stores in 47 states and Canada, and 14 Jimmy's stores in 11 states. |
|
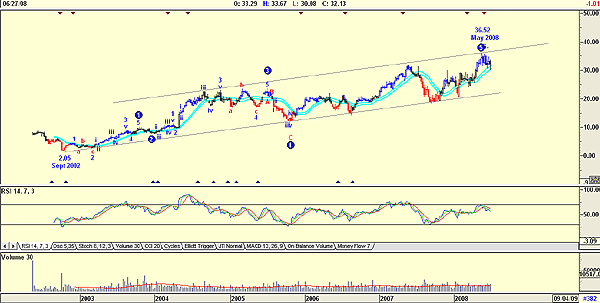
| FIGURE 1: AEROPOSTALE, WEEKLY. This weekly chart shows a possible wave count. |
| Graphic provided by: AdvancedGET. |
| |
| Figure 1 is a weekly chart and shows how the stock price rose from a low of $2.05 in September 2002 to a high of $36.52 in May 2008. The price has honored the rising channel and appears to be topping out at present prices, suggesting a down move to test the lower support line. This appears to be confirmed by the relative strength index (RSI), although I would prefer to see the indicator rise above the 70 level and then trigger a sell signal as it falls below. The fact that this hasn't happened does suggest that there may be some upside left. But is it worth taking the risk in current market conditions? To answer this question, I look at the daily chart. |
|
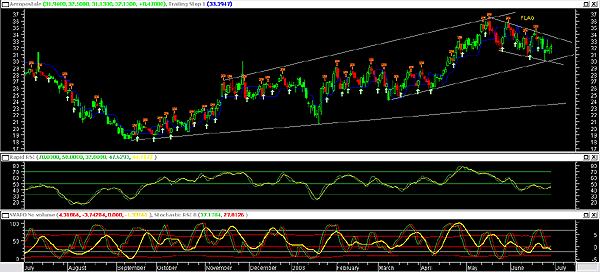
| FIGURE 2: AEROPOSTALE, DAILY. This daily chart shows indicators shouting, "Watch me!" |
| Graphic provided by: MetaStock. |
| |
| Figure 2 shows the following indicators: a. Rapid RSI. This indicator has not given a buy signal. I would prefer that it fall below the 30 level, then rise before triggering a buy. However, when we look back at the last rise in the stock price, we can see that the indicator broke below the 50 level, then rose above it, giving a buy. b. SVAPO (strong yellow indicator in the second inner window). This indicator gave a buy signal on June 12, when the price closed at $32.42. c. The third indicator is the stochastic RSI. This indicator is the one that triggered the buy signal, and brought the stock to my attention for further analysis. d. Finally, the blue line on the chart itself. This is a trailing stop. The share price is currently below this stop, a deterrent to buying at present prices, but the trailing stop should not be used as a trigger. It could, however, be used as a confirmation of price trend. e. The buy and sell arrows on the chart. These arrows are triggered by the explorer program on MetaStock. The most recent signal was a buy on June 19. f. Finally, the chart pattern resembles a flag pattern, one of the reasons the stock is now on my watchlist. Aeropostale is a company I have placed on my watchlist. With a recessionary Dow Jones Industrial Average (DJIA), and a Standard & Poor's 500 following the downtrend, we would not buy now. Rather watch the flag formation and wait for the buy signal, especially when the blood is running in the streets. |
Has been a technical analyst since 1969, and has worked as a futures and options trader with First Financial Futures in Johannesburg, South Africa.
| Address: | 3256 West 24th Ave |
| Vancouver, BC | |
| Phone # for sales: | 6042634214 |
| E-mail address: | petroosp@gmail.com |
Click here for more information about our publications!
Comments
Date:�07/01/08Rank:�2Comment:�

Request Information From Our Sponsors
- StockCharts.com, Inc.
- Candle Patterns
- Candlestick Charting Explained
- Intermarket Technical Analysis
- John Murphy on Chart Analysis
- John Murphy's Chart Pattern Recognition
- John Murphy's Market Message
- MurphyExplainsMarketAnalysis-Intermarket Analysis
- MurphyExplainsMarketAnalysis-Visual Analysis
- StockCharts.com
- Technical Analysis of the Financial Markets
- The Visual Investor
- VectorVest, Inc.
- Executive Premier Workshop
- One-Day Options Course
- OptionsPro
- Retirement Income Workshop
- Sure-Fire Trading Systems (VectorVest, Inc.)
- Trading as a Business Workshop
- VectorVest 7 EOD
- VectorVest 7 RealTime/IntraDay
- VectorVest AutoTester
- VectorVest Educational Services
- VectorVest OnLine
- VectorVest Options Analyzer
- VectorVest ProGraphics v6.0
- VectorVest ProTrader 7
- VectorVest RealTime Derby Tool
- VectorVest Simulator
- VectorVest Variator
- VectorVest Watchdog