HOT TOPICS LIST
- MACD
- Fibonacci
- RSI
- Gann
- ADXR
- Stochastics
- Volume
- Triangles
- Futures
- Cycles
- Volatility
- ZIGZAG
- MESA
- Retracement
- Aroon
INDICATORS LIST
LIST OF TOPICS
PRINT THIS ARTICLE
by Mike Carr, CMT
As layoffs mount, staffing companies can profit by helping to locate replacements for senior managers and offering consulting services to help with the changing corporate culture. That's what Korn/Ferry can do.
Position: Buy
Mike Carr, CMT
Mike Carr, CMT, is a member of the Market Technicians Association, and editor of the MTA's newsletter, Technically Speaking. He is also the author of "Smarter Investing in Any Economy: The Definitive Guide to Relative Strength Investing," and "Conquering the Divide: How to Use Economic Indicators to Catch Stock Market Trends."
PRINT THIS ARTICLE
STRATEGIES
Technical Indicators Add Up To A Long For Korn/Ferry
06/30/08 11:39:17 AMby Mike Carr, CMT
As layoffs mount, staffing companies can profit by helping to locate replacements for senior managers and offering consulting services to help with the changing corporate culture. That's what Korn/Ferry can do.
Position: Buy
| Korn/Ferry International (KFY) says that the company can "provide talent management solutions worldwide ... with services that include executive recruitment, middle-management recruitment, outsourced recruitment, and leadership development solutions." Although the headlines tell us there should be an opportunity to profit in this field, the charts tell us whether to buy or sell. |
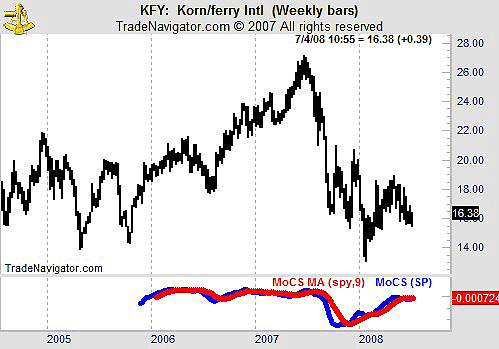
| Starting with the weekly chart (Figure 1), we can see that prices are at what may be the beginning of an uptrend. The recent lows coincide with support levels dating back to 2005, and the most recent action has been a series of higher highs and higher lows. Weekly momentum, shown with the momentum of comparative strength (MOCS), is bullish. MOCS applies a moving average convergence/divergence (MACD)-like calculation to relative strength and makes it easy to spot turning points in strength on a chart. |

|
| FIGURE 1: KFY, WEEKLY. Although early, it appears that the downtrend in KFY has been reversed. |
| Graphic provided by: Trade Navigator. |
| |
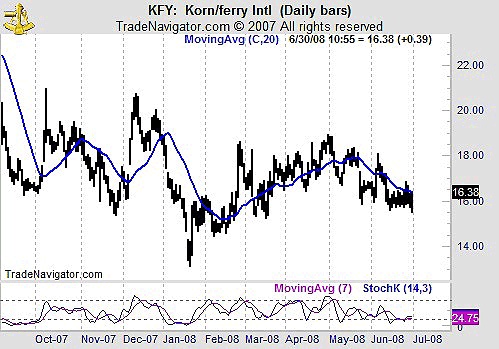
| The daily chart (Figure 2) is used to confirm the longer time frame. In this case, we see that prices have been in a tight consolidation pattern. Within the past few days, the stochastics indicator has completed a bullish crossover after reaching oversold levels. A break above the 20-day moving average should be the final signal for conservative investors to initiate long positions. Aggressive traders should enter the position at current levels. |

|
| FIGURE 2: KFY, DAILY. With prices challenging the 20-day moving average, the bullish stochastic indicates that the next move should be higher. |
| Graphic provided by: Trade Navigator. |
| |
| Additional bullish support is found in the large short interest in KFY. Buyins.net reports that shorts will need almost three weeks of normal trading volume to cover their positions in this stock. With more than 12% of the float shorted, there is a lot of potential demand. The squeeze trigger represents the average price level where short positions were initiated. At this level, many shorts are likely to cover their trade and find a more profitable opportunity in the market. Buyins.net calculates that the average short is now losing money since the squeeze trigger is 16.23. KFY represents a strong buy with risk limited by a stop below the recent lows near 15.50. |
Mike Carr, CMT, is a member of the Market Technicians Association, and editor of the MTA's newsletter, Technically Speaking. He is also the author of "Smarter Investing in Any Economy: The Definitive Guide to Relative Strength Investing," and "Conquering the Divide: How to Use Economic Indicators to Catch Stock Market Trends."
| Website: | www.moneynews.com/blogs/MichaelCarr/id-73 |
| E-mail address: | marketstrategist@gmail.com |
Click here for more information about our publications!
Comments

Request Information From Our Sponsors
- StockCharts.com, Inc.
- Candle Patterns
- Candlestick Charting Explained
- Intermarket Technical Analysis
- John Murphy on Chart Analysis
- John Murphy's Chart Pattern Recognition
- John Murphy's Market Message
- MurphyExplainsMarketAnalysis-Intermarket Analysis
- MurphyExplainsMarketAnalysis-Visual Analysis
- StockCharts.com
- Technical Analysis of the Financial Markets
- The Visual Investor
- VectorVest, Inc.
- Executive Premier Workshop
- One-Day Options Course
- OptionsPro
- Retirement Income Workshop
- Sure-Fire Trading Systems (VectorVest, Inc.)
- Trading as a Business Workshop
- VectorVest 7 EOD
- VectorVest 7 RealTime/IntraDay
- VectorVest AutoTester
- VectorVest Educational Services
- VectorVest OnLine
- VectorVest Options Analyzer
- VectorVest ProGraphics v6.0
- VectorVest ProTrader 7
- VectorVest RealTime Derby Tool
- VectorVest Simulator
- VectorVest Variator
- VectorVest Watchdog
