HOT TOPICS LIST
- MACD
- Fibonacci
- RSI
- Gann
- ADXR
- Stochastics
- Volume
- Triangles
- Futures
- Cycles
- Volatility
- ZIGZAG
- MESA
- Retracement
- Aroon
INDICATORS LIST
LIST OF TOPICS
PRINT THIS ARTICLE
by Mike Carr, CMT
Even as the market averages move into bear market territory, long trades can be found using technical trading strategies.
Position: Buy
Mike Carr, CMT
Mike Carr, CMT, is a member of the Market Technicians Association, and editor of the MTA's newsletter, Technically Speaking. He is also the author of "Smarter Investing in Any Economy: The Definitive Guide to Relative Strength Investing," and "Conquering the Divide: How to Use Economic Indicators to Catch Stock Market Trends."
PRINT THIS ARTICLE
STRATEGIES
A Long Trade In A Declining Market
06/30/08 10:05:49 AMby Mike Carr, CMT
Even as the market averages move into bear market territory, long trades can be found using technical trading strategies.
Position: Buy
| Fred's (FRED) operates nearly 700 discount general merchandise stores and almost 300 pharmacies in 15 states, primarily in the southeastern United States. With revenue of $1.8 billion, it's actually a smaller player in its industry. But it has the highest price/earnings (P/E) ratio among discount stores. Earnings estimates have been moving steadily higher, and earnings growth is expected to continue at a double-digit pace for the next five years. |
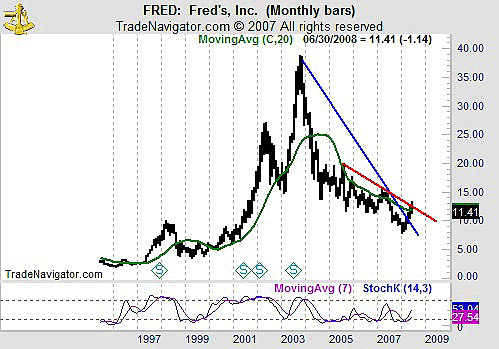
| The stock has recently broken through an extended downtrend since 2003 (the blue line in Figure 1). A shorter-term trendline, extending back to 2005, has also been broken to the upside (the red line). Prices are also right at the 20-month moving average (the green line in Figure 1), a line that has shown clear trend changes when broken decisively in the past. The stochastic is also bullish, a condition that has signaled at least brief rallies in the past. |

|
| FIGURE 1: FRED, MONTHLY. Current prices in FRED may have broken a long-term downtrend. |
| Graphic provided by: Trade Navigator. |
| |
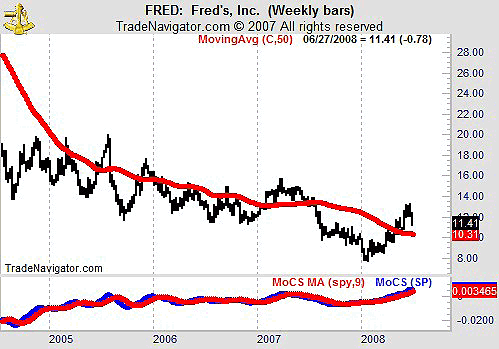
| The weekly chart of FRED (Figure 2) shows that price is above the 50-week moving average, a level that has been whipsawed repeatedly since 2006. Momentum, shown as the momentum of comparative strength (MOCS), is bullish. MOCS applies a moving average convergence/divergence (MACD)-like calculation to relative strength and makes it easy to spot turning points in strength on a chart. |

|
| FIGURE 2: FRED, WEEKLY. The weekly chart is also bullish and shows relative strength is confirming the price action. |
| Graphic provided by: Trade Navigator. |
| |
| Buying FRED in an oversold market offers a low-risk long strategy. The 50-week moving average provides a stop-loss point about a dollar below current prices. The first significant overhead resistance is three points higher. A three-to-one reward-to-risk ratio on a long trade in the current market environment is a compelling opportunity. |
Mike Carr, CMT, is a member of the Market Technicians Association, and editor of the MTA's newsletter, Technically Speaking. He is also the author of "Smarter Investing in Any Economy: The Definitive Guide to Relative Strength Investing," and "Conquering the Divide: How to Use Economic Indicators to Catch Stock Market Trends."
| Website: | www.moneynews.com/blogs/MichaelCarr/id-73 |
| E-mail address: | marketstrategist@gmail.com |
Click here for more information about our publications!
PRINT THIS ARTICLE

Request Information From Our Sponsors
- StockCharts.com, Inc.
- Candle Patterns
- Candlestick Charting Explained
- Intermarket Technical Analysis
- John Murphy on Chart Analysis
- John Murphy's Chart Pattern Recognition
- John Murphy's Market Message
- MurphyExplainsMarketAnalysis-Intermarket Analysis
- MurphyExplainsMarketAnalysis-Visual Analysis
- StockCharts.com
- Technical Analysis of the Financial Markets
- The Visual Investor
- VectorVest, Inc.
- Executive Premier Workshop
- One-Day Options Course
- OptionsPro
- Retirement Income Workshop
- Sure-Fire Trading Systems (VectorVest, Inc.)
- Trading as a Business Workshop
- VectorVest 7 EOD
- VectorVest 7 RealTime/IntraDay
- VectorVest AutoTester
- VectorVest Educational Services
- VectorVest OnLine
- VectorVest Options Analyzer
- VectorVest ProGraphics v6.0
- VectorVest ProTrader 7
- VectorVest RealTime Derby Tool
- VectorVest Simulator
- VectorVest Variator
- VectorVest Watchdog
