HOT TOPICS LIST
- MACD
- Fibonacci
- RSI
- Gann
- ADXR
- Stochastics
- Volume
- Triangles
- Futures
- Cycles
- Volatility
- ZIGZAG
- MESA
- Retracement
- Aroon
INDICATORS LIST
LIST OF TOPICS
PRINT THIS ARTICLE
by Mike Carr, CMT
After breaking key support at 12,000, the next thousand-point move in the Dow Jones Industrial Average is more likely to be down than up.
Position: Sell
Mike Carr, CMT
Mike Carr, CMT, is a member of the Market Technicians Association, and editor of the MTA's newsletter, Technically Speaking. He is also the author of "Smarter Investing in Any Economy: The Definitive Guide to Relative Strength Investing," and "Conquering the Divide: How to Use Economic Indicators to Catch Stock Market Trends."
PRINT THIS ARTICLE
STRATEGIES
Dow Industrials Looking Bearish
06/26/08 09:36:36 AMby Mike Carr, CMT
After breaking key support at 12,000, the next thousand-point move in the Dow Jones Industrial Average is more likely to be down than up.
Position: Sell
| The 12,000 level in the Dow Jones Industrial Average (DJIA) has provided support since early 2007. Recently, the index decisively closed below that on daily and weekly charts. It now looks like all the price action last year was a topping consolidation pattern. |
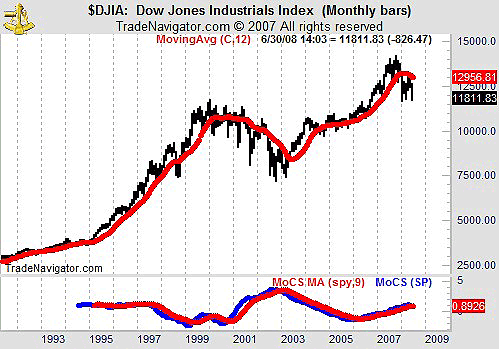
| In Figure 1, the weekly monthly chart of DJIA shows the momentum of comparative strength (MOCS), which applies a moving average convergence/divergence (MACD)–type calculation to relative strength. In Figure 1 we see a recent bearish crossover in this indicator, a sign of price trend change on previous occurrences in this average. While in an individual stock, this would likely mean that prices will follow momentum, the interpretation for an index requires more flexibility. The MOCS indicates that the DJIA is now likely to underperform the S&P and although both may rise, the DJIA is likely to increase at a slower rate. We can also see that prices have been below the one-year moving average throughout 2008, a bearish indicator. |

|
| FIGURE 1: DJIA, MONTHLY. Relative strength in the DJIA is weakening, indicating that there are better investment opportunities elsewhere in the market. |
| Graphic provided by: Trade Navigator. |
| |
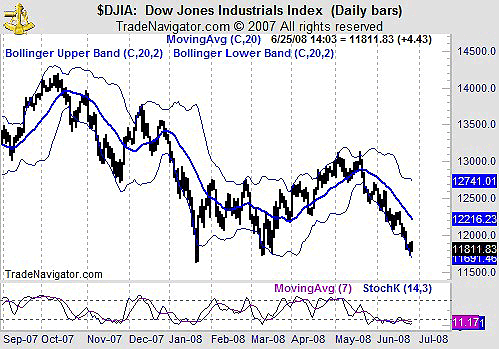
| We can turn to the daily chart (Figure 2) to develop a trading strategy. Short-term stochastics is at an oversold level. Prices have been walking lower along the Bollinger band for the past month, unusually bearish behavior. From here, a consolidation is likely before prices continue heading lower. |

|
| FIGURE 2: DJIA, DAILY. The DJIA looks to be oversold on the daily chart. |
| Graphic provided by: Trade Navigator. |
| |
| Shorting at the current level is likely to lead to initial short-term losses. Waiting for a pullback toward the 20-day moving average is a more conservative approach to entering this trade. A move to the upper Bollinger band would serve as a loose stop-loss; the 20-day moving average could also be used, but whipsaws are possible. Traders should look at the Diamonds Trust (DIA) exchange traded fund to implement a short, although futures and options can also be used. |
Mike Carr, CMT, is a member of the Market Technicians Association, and editor of the MTA's newsletter, Technically Speaking. He is also the author of "Smarter Investing in Any Economy: The Definitive Guide to Relative Strength Investing," and "Conquering the Divide: How to Use Economic Indicators to Catch Stock Market Trends."
| Website: | www.moneynews.com/blogs/MichaelCarr/id-73 |
| E-mail address: | marketstrategist@gmail.com |
Click here for more information about our publications!
Comments
Date: 06/29/08Rank: 3Comment:

Request Information From Our Sponsors
- StockCharts.com, Inc.
- Candle Patterns
- Candlestick Charting Explained
- Intermarket Technical Analysis
- John Murphy on Chart Analysis
- John Murphy's Chart Pattern Recognition
- John Murphy's Market Message
- MurphyExplainsMarketAnalysis-Intermarket Analysis
- MurphyExplainsMarketAnalysis-Visual Analysis
- StockCharts.com
- Technical Analysis of the Financial Markets
- The Visual Investor
- VectorVest, Inc.
- Executive Premier Workshop
- One-Day Options Course
- OptionsPro
- Retirement Income Workshop
- Sure-Fire Trading Systems (VectorVest, Inc.)
- Trading as a Business Workshop
- VectorVest 7 EOD
- VectorVest 7 RealTime/IntraDay
- VectorVest AutoTester
- VectorVest Educational Services
- VectorVest OnLine
- VectorVest Options Analyzer
- VectorVest ProGraphics v6.0
- VectorVest ProTrader 7
- VectorVest RealTime Derby Tool
- VectorVest Simulator
- VectorVest Variator
- VectorVest Watchdog
