HOT TOPICS LIST
- MACD
- Fibonacci
- RSI
- Gann
- ADXR
- Stochastics
- Volume
- Triangles
- Futures
- Cycles
- Volatility
- ZIGZAG
- MESA
- Retracement
- Aroon
INDICATORS LIST
LIST OF TOPICS
PRINT THIS ARTICLE
by Mike Carr, CMT
After building an extended base, TJX looks ready to move higher.
Position: Buy
Mike Carr, CMT
Mike Carr, CMT, is a member of the Market Technicians Association, and editor of the MTA's newsletter, Technically Speaking. He is also the author of "Smarter Investing in Any Economy: The Definitive Guide to Relative Strength Investing," and "Conquering the Divide: How to Use Economic Indicators to Catch Stock Market Trends."
PRINT THIS ARTICLE
STRATEGIES
Is TJX Ready To Move Higher?
06/24/08 11:03:54 AMby Mike Carr, CMT
After building an extended base, TJX looks ready to move higher.
Position: Buy
| TJX Cos. (TJX) operates off-price clothing and home fashions in the US and internationally through several retail chains. Its stores are called TJ Maxx, Marshalls, A.J. Wright, and Bob's Stores in the US; Winners in Canada; and TK Maxx in Europe. Altogether, more than 2,000 stores provide healthy profits to the company. |
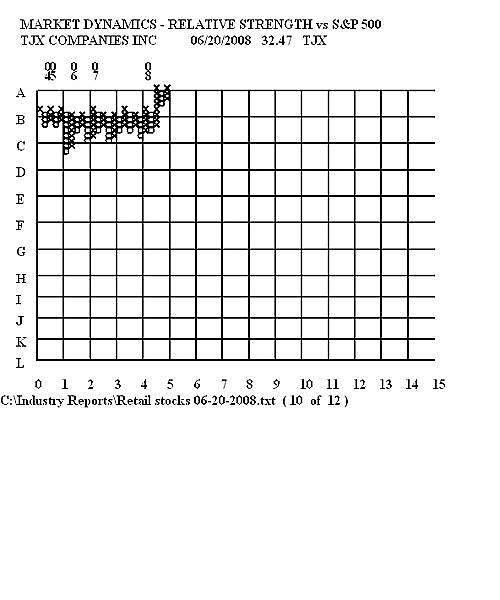
| While earnings growth has been steady, it has been relatively slow, averaging only 12% per year over the past five years. It is projected to improve slightly to 14% over the next five years. The stock has been in a trading range for years. In Figure 1, we can see in a point & figure chart of relative strength that this stock has moved in line with the market since 2004. Earlier this year, it finally broke out of the consolidation pattern and relative strength is trending higher. |

|
| FIGURE 1: TJX. Relative strength in TJX has just broken out of a four-year basing pattern. Breakouts from extended bases can be very powerful. |
| Graphic provided by: Market Dynamics. |
| |
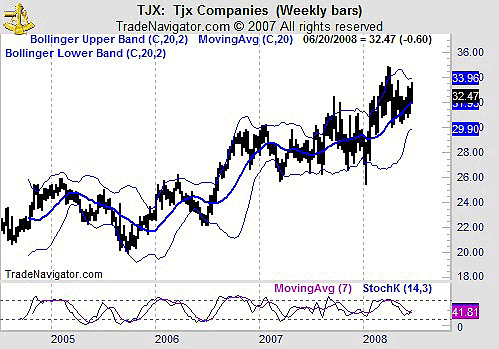
| More traditional indicators also offer bullish signals. The stochastic, shown in Figure 2 for the weekly chart, recently completed a bullish crossover. Prices are in a consolidation pattern and the Bollinger bands are narrowing, often a sign of an impending breakout in price. |

|
| FIGURE 2: TJX, WEEKLY. Here, we can see that stochastics has just given a buy signal. |
| Graphic provided by: Trade Navigator. |
| |
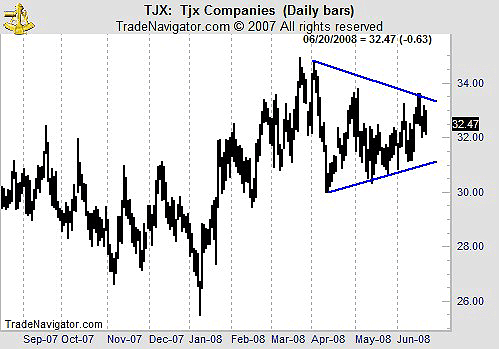
| The daily chart (Figure 3) offers precise price levels for the trade. Again we see that prices are in an area of consolidation. The upper trendline provides a buy level for conservative traders near 33.25. Aggressive traders would enter at the current level based upon the breakout in relative strength and stochastics signals. All traders should set a stop below the lower trendline, at 31. |

|
| FIGURE 3: TJX, DAILY. The daily chart is used to identify the buy and stop points for the trade. |
| Graphic provided by: Trade Navigator. |
| |
| Relative strength is a good tool for finding potential trades. Other technical tools can be used to refine the idea into a potentially profitable strategy. |
Mike Carr, CMT, is a member of the Market Technicians Association, and editor of the MTA's newsletter, Technically Speaking. He is also the author of "Smarter Investing in Any Economy: The Definitive Guide to Relative Strength Investing," and "Conquering the Divide: How to Use Economic Indicators to Catch Stock Market Trends."
| Website: | www.moneynews.com/blogs/MichaelCarr/id-73 |
| E-mail address: | marketstrategist@gmail.com |
Click here for more information about our publications!
PRINT THIS ARTICLE

Request Information From Our Sponsors
- VectorVest, Inc.
- Executive Premier Workshop
- One-Day Options Course
- OptionsPro
- Retirement Income Workshop
- Sure-Fire Trading Systems (VectorVest, Inc.)
- Trading as a Business Workshop
- VectorVest 7 EOD
- VectorVest 7 RealTime/IntraDay
- VectorVest AutoTester
- VectorVest Educational Services
- VectorVest OnLine
- VectorVest Options Analyzer
- VectorVest ProGraphics v6.0
- VectorVest ProTrader 7
- VectorVest RealTime Derby Tool
- VectorVest Simulator
- VectorVest Variator
- VectorVest Watchdog
- StockCharts.com, Inc.
- Candle Patterns
- Candlestick Charting Explained
- Intermarket Technical Analysis
- John Murphy on Chart Analysis
- John Murphy's Chart Pattern Recognition
- John Murphy's Market Message
- MurphyExplainsMarketAnalysis-Intermarket Analysis
- MurphyExplainsMarketAnalysis-Visual Analysis
- StockCharts.com
- Technical Analysis of the Financial Markets
- The Visual Investor
