HOT TOPICS LIST
- MACD
- Fibonacci
- RSI
- Gann
- ADXR
- Stochastics
- Volume
- Triangles
- Futures
- Cycles
- Volatility
- ZIGZAG
- MESA
- Retracement
- Aroon
INDICATORS LIST
LIST OF TOPICS
PRINT THIS ARTICLE
by Koos van der Merwe
To determine the movement of the oil price, I looked at the oil ETF.
Position: Sell
Koos van der Merwe
Has been a technical analyst since 1969, and has worked as a futures and options trader with First Financial Futures in Johannesburg, South Africa.
PRINT THIS ARTICLE
ELLIOTT WAVE
Where Is The Price Of Oil Going?
06/23/08 08:41:36 AMby Koos van der Merwe
To determine the movement of the oil price, I looked at the oil ETF.
Position: Sell
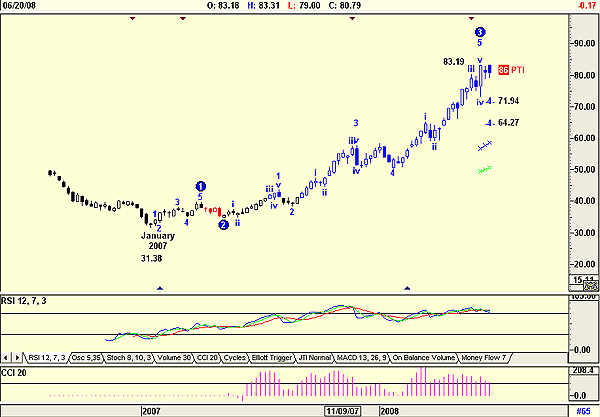
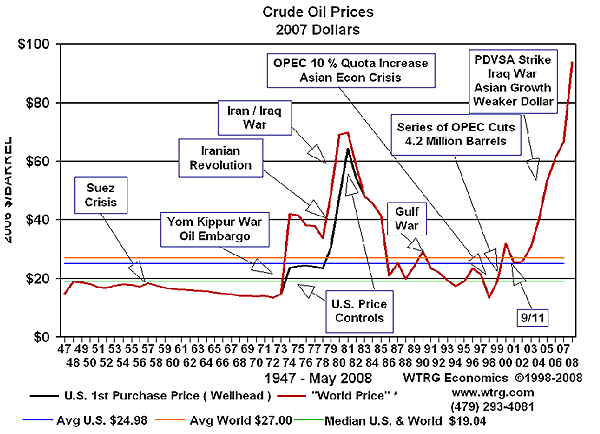
| The iPath Goldman Sachs Crude Oil Total Return Index ETN (OIL) is a subindex of the Goldman Sachs Commodity Index. The Goldman Sachs Crude Oil Total Return Index reflects the returns that are potentially available through an unleveraged investment in the West Texas Intermediate (WTI) crude oil futures contract plus the Treasury bill rate of interest that could be earned on funds committed to the trading of the underlying contracts. Figure 1 is a weekly chart of the ETF, which shows how the price moved up strongly from January 2007 when the ETF traded at $31.38 to the present value of $83.29. This move gives us an idea of the move in the oil price, although when we consider that the price of oil moved from below $20 in 1997 to present levels (see Figure 2), an increase in the region of 595%, we have to wonder how we got here. Unfortunately, the ETF did not exist in 1997. The earliest data I have is from August 2006. |

|
| FIGURE 1: OIL, WEEKLY. Here's a weekly chart of the oil ETF, showing the Elliott wave count. |
| Graphic provided by: AdvancedGET. |
| |
| Figure 1, however, does show the ETF consolidating at present levels, and suggests that a wave 3 has been completed, with an 86% probability (PTI) of the price now falling into a fourth-wave correction. The targets are shown. Both the relative strength index (RSI) and commodity channel index (CCI ) are suggesting overbought positions and possible sell signals. |

|
| FIGURE 2: THE RECENT HISTORY OF OIL. The movement of the oil price, with historical events causing that movement. |
| Graphic provided by: WTRG Economics. |
| |
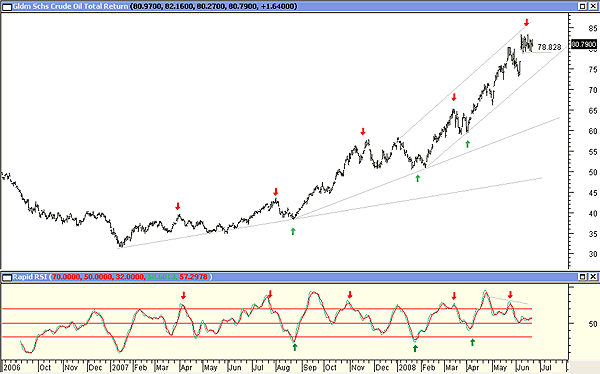
| Figure 3 is a daily chart of the ETF and refines the support and resistance figures given, suggesting that a break below the level of 79.53 could see the price falling to test the lower trendline and, ultimately, the targets of the fourth wave. Figure 3 shows my preferred indicator, and rapid RSI confirming weakness in the ETF. Fibonacci retracement levels are suggesting targets of $71 and $64. |

|
| FIGURE 3: OIL ETF, DAILY. This chart shows what could be a flag pattern forming. |
| Graphic provided by: MetaStock. |
| |
| How accurate is the ETF in predicting the oil price? Considering the ETF is based on a crude oil futures contract, it is a prediction of the expected rather than the actual price of oil, but that expectation would be based on the movement of the actual oil price per barrel. For example, in January 2007, the oil price per barrel was $46.53, while the ETF was $32.03. The ETF was therefore conservative but as the oil price moved to $83.46 by December 2007 (an increase of 79%), the ETF moved to $57.87, an increase of 81%, a pretty good reflection of the movement of oil. According to the chart of the ETF, we should see a weakening in the oil price over the coming weeks. Referring back to Figure 3, one disturbing thought is that the recent formation looks very much like a flag pattern, and as we all know, a flag pattern signifies consolidation ahead of a move up. Let us hope that for once this pattern is a failure. |
Has been a technical analyst since 1969, and has worked as a futures and options trader with First Financial Futures in Johannesburg, South Africa.
| Address: | 3256 West 24th Ave |
| Vancouver, BC | |
| Phone # for sales: | 6042634214 |
| E-mail address: | petroosp@gmail.com |
Click here for more information about our publications!
PRINT THIS ARTICLE

Request Information From Our Sponsors
- StockCharts.com, Inc.
- Candle Patterns
- Candlestick Charting Explained
- Intermarket Technical Analysis
- John Murphy on Chart Analysis
- John Murphy's Chart Pattern Recognition
- John Murphy's Market Message
- MurphyExplainsMarketAnalysis-Intermarket Analysis
- MurphyExplainsMarketAnalysis-Visual Analysis
- StockCharts.com
- Technical Analysis of the Financial Markets
- The Visual Investor
- VectorVest, Inc.
- Executive Premier Workshop
- One-Day Options Course
- OptionsPro
- Retirement Income Workshop
- Sure-Fire Trading Systems (VectorVest, Inc.)
- Trading as a Business Workshop
- VectorVest 7 EOD
- VectorVest 7 RealTime/IntraDay
- VectorVest AutoTester
- VectorVest Educational Services
- VectorVest OnLine
- VectorVest Options Analyzer
- VectorVest ProGraphics v6.0
- VectorVest ProTrader 7
- VectorVest RealTime Derby Tool
- VectorVest Simulator
- VectorVest Variator
- VectorVest Watchdog
