HOT TOPICS LIST
- MACD
- Fibonacci
- RSI
- Gann
- ADXR
- Stochastics
- Volume
- Triangles
- Futures
- Cycles
- Volatility
- ZIGZAG
- MESA
- Retracement
- Aroon
INDICATORS LIST
LIST OF TOPICS
PRINT THIS ARTICLE
by Dennis D. Peterson
Volume tells you how many shares are traded and thus provides a measure of buying and selling enthusiasm.
Position: N/A
Dennis D. Peterson
Market index trading on a daily basis.
PRINT THIS ARTICLE
VOLUME
Volume Analysis (Part II of IV)
05/21/01 11:10:50 AMby Dennis D. Peterson
Volume tells you how many shares are traded and thus provides a measure of buying and selling enthusiasm.
Position: N/A
| Volume analysis studies price movement in relation to volume. It analyzes in-gear volume moves (prices moving up on increasing volume or prices moving down on decreasing volume) versus out-of-gear moves (prices moving up on decreasing volume and prices moving down on increasing volume). |
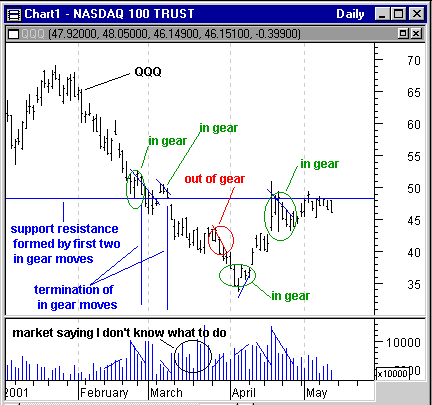
| Applying the same analysis technique used on AOL (Part I) to QQQ (Figure 1: QQQ daily price and volume) gives a similar result. I want to find the market's comfort zone by first locating increasing or decreasing volume patterns. I don't expect them to occur sequentially because the market will go through periods of uncertainty. Since stocks move sideways 50% of the time, I expect volume to be thrashing around more often than following a trend. When I notice either an increasing or decreasing volume pattern, I look at price movement to determine if the market is in-gear or out-of-gear. An out-of-gear market is an uncomfortable one and the market will attempt to adjust. In such instances, I will look for signs of panic-type selling (decreasing price on high volume) and overexuberant buying (higher prices on lowered volume). |

|
| Figure 1: QQQ daily price and volume. Using volume trends in conjunction with price trends helps determine support and resistance to price. In gear moves reflect "rationale" moves, while out of gear moves reflect overreaction. |
| Graphic provided by: MetaStock. |
| Graphic provided by: Data vendor: eSignal<. |
| |
| Looking at the chart of QQQ, I find that the first two in-gear moves both terminate at QQQ = 48.5. Panic-type selling follows the second in-gear move driving the price down to 45 and the market then goes into a mode of not knowing what to do. I continue moving towards the right on the chart to look for volume patterns. I next find an out of gear move, which suggests the market will be uncomfortable with prices going that low. Sure enough, the market next corrects with an in-gear price increase. When QQQ reaches 48.5 again, it goes through an in-gear drop to QQQ = 46. So at this moment (5/10/2001), the market's comfort zone is very likely sitting at 46. The market will form another opinion later on. I want to know whether the market is comfortable with its latest price assessment. While the marketplace is deciding, prices are likely to jump around. The market most recently ended an indecision period, which occurred in late March, with an out of gear downward move. So the trade would be to sell short when QQQ hits 48.5, cover at 46, with a stop-loss for your short at 49.5. |
Market index trading on a daily basis.
| Title: | Staff Writer |
| Company: | Technical Analysis, Inc. |
| Address: | 4757 California Ave SW |
| Seattle, WA 98116-4499 | |
| Phone # for sales: | 206 938 0570 |
| Fax: | 206 938 1307 |
| Website: | www.traders.com |
| E-mail address: | dpeterson@traders.com |
Traders' Resource Links | |
| Charting the Stock Market: The Wyckoff Method -- Books | |
| Working-Money.com -- Online Trading Services | |
| Traders.com Advantage -- Online Trading Services | |
| Technical Analysis of Stocks & Commodities -- Publications and Newsletters | |
| Working Money, at Working-Money.com -- Publications and Newsletters | |
| Traders.com Advantage -- Publications and Newsletters | |
| Professional Traders Starter Kit -- Software | |
Click here for more information about our publications!
Comments
Date: 05/22/01Rank: 4Comment:
Date: 05/23/01Rank: 4Comment:

Request Information From Our Sponsors
- VectorVest, Inc.
- Executive Premier Workshop
- One-Day Options Course
- OptionsPro
- Retirement Income Workshop
- Sure-Fire Trading Systems (VectorVest, Inc.)
- Trading as a Business Workshop
- VectorVest 7 EOD
- VectorVest 7 RealTime/IntraDay
- VectorVest AutoTester
- VectorVest Educational Services
- VectorVest OnLine
- VectorVest Options Analyzer
- VectorVest ProGraphics v6.0
- VectorVest ProTrader 7
- VectorVest RealTime Derby Tool
- VectorVest Simulator
- VectorVest Variator
- VectorVest Watchdog
- StockCharts.com, Inc.
- Candle Patterns
- Candlestick Charting Explained
- Intermarket Technical Analysis
- John Murphy on Chart Analysis
- John Murphy's Chart Pattern Recognition
- John Murphy's Market Message
- MurphyExplainsMarketAnalysis-Intermarket Analysis
- MurphyExplainsMarketAnalysis-Visual Analysis
- StockCharts.com
- Technical Analysis of the Financial Markets
- The Visual Investor
