HOT TOPICS LIST
- MACD
- Fibonacci
- RSI
- Gann
- ADXR
- Stochastics
- Volume
- Triangles
- Futures
- Cycles
- Volatility
- ZIGZAG
- MESA
- Retracement
- Aroon
INDICATORS LIST
LIST OF TOPICS
PRINT THIS ARTICLE
by Mike Carr, CMT
Sometimes we can learn all we need to by looking at the chart, even without knowing the name of the company.
Position: Sell
Mike Carr, CMT
Mike Carr, CMT, is a member of the Market Technicians Association, and editor of the MTA's newsletter, Technically Speaking. He is also the author of "Smarter Investing in Any Economy: The Definitive Guide to Relative Strength Investing," and "Conquering the Divide: How to Use Economic Indicators to Catch Stock Market Trends."
PRINT THIS ARTICLE
STRATEGIES
The Chart Tells The Story
06/19/08 08:37:02 AMby Mike Carr, CMT
Sometimes we can learn all we need to by looking at the chart, even without knowing the name of the company.
Position: Sell
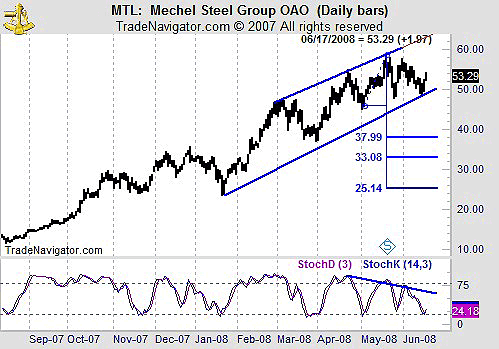
| The daily chart of Mechel Open Joint Stock Co. (MTL) in Figure 1 is bearish. We can make that assessment solely from the chart, without even knowing what the company does. But for those who are curious, Mechel is a Russian mining and steel company. Analysts are looking for earnings to decline by about 10% this year and average a below-average growth rate of 5% a year after that. Knowing this, we can see that the chart supports the poor fundamental outlook. |

|
| FIGURE 1: MTL, DAILY. While recent price action in MTL has been confined to a channel, it is likely that prices will break to the downside soon. |
| Graphic provided by: Trade Navigator. |
| |
| Since the beginning of 2008, prices have remained within the upper and lower bounds of the channel lines drawn in Figure 1. Since April, momentum, shown here as the stochastic, has failed to confirm price advances to the upper line. While trading within this channel, extremes in the stochastic indicator have identified profitable trading pints. |
| In addition, prices in MTL have recently formed a topping pattern. This pattern may be considered a rough head & shoulders or a poorly formed rectangle. The name of the pattern is less important than its implications. In this case, a measured move of almost 15 points makes this a pattern worth trading. |
| Stochastics indicates that a long position could be initiated here. However, there is a short-term downtrend on the chart, and it would be better to go short at current levels. Conservative traders can wait for the price to drop below the lower channel line before entering a position. A stop-loss above recent highs near 55 offers initial protection. As the trade becomes profitable, the 20-day moving average is a logical trailing stop. |
Mike Carr, CMT, is a member of the Market Technicians Association, and editor of the MTA's newsletter, Technically Speaking. He is also the author of "Smarter Investing in Any Economy: The Definitive Guide to Relative Strength Investing," and "Conquering the Divide: How to Use Economic Indicators to Catch Stock Market Trends."
| Website: | www.moneynews.com/blogs/MichaelCarr/id-73 |
| E-mail address: | marketstrategist@gmail.com |
Click here for more information about our publications!
PRINT THIS ARTICLE

Request Information From Our Sponsors
- StockCharts.com, Inc.
- Candle Patterns
- Candlestick Charting Explained
- Intermarket Technical Analysis
- John Murphy on Chart Analysis
- John Murphy's Chart Pattern Recognition
- John Murphy's Market Message
- MurphyExplainsMarketAnalysis-Intermarket Analysis
- MurphyExplainsMarketAnalysis-Visual Analysis
- StockCharts.com
- Technical Analysis of the Financial Markets
- The Visual Investor
- VectorVest, Inc.
- Executive Premier Workshop
- One-Day Options Course
- OptionsPro
- Retirement Income Workshop
- Sure-Fire Trading Systems (VectorVest, Inc.)
- Trading as a Business Workshop
- VectorVest 7 EOD
- VectorVest 7 RealTime/IntraDay
- VectorVest AutoTester
- VectorVest Educational Services
- VectorVest OnLine
- VectorVest Options Analyzer
- VectorVest ProGraphics v6.0
- VectorVest ProTrader 7
- VectorVest RealTime Derby Tool
- VectorVest Simulator
- VectorVest Variator
- VectorVest Watchdog
