

HOT TOPICS LIST
- MACD
- Fibonacci
- RSI
- Gann
- ADXR
- Stochastics
- Volume
- Triangles
- Futures
- Cycles
- Volatility
- ZIGZAG
- MESA
- Retracement
- Aroon
INDICATORS LIST
LIST OF TOPICS
PRINT THIS ARTICLE
by Alan R. Northam
By casual observation, XLF looks like it is forming a double bottom, but don't be taken in. XLF has found some short-term support, but the main trend is still down, and here's why.
Position: N/A
Alan R. Northam
Alan Northam lives in the Dallas, Texas area and as an electronic engineer gave him an analytical mind from which he has developed a thorough knowledge of stock market technical analysis. His abilities to analyze the future direction of the stock market has allowed him to successfully trade of his own portfolio over the last 30 years. Mr. Northam is now retired and trading the stock market full time. You can reach him at inquiry@tradersclassroom.com or by visiting his website at http://www.tradersclassroom.com. You can also follow him on Twitter @TradersClassrm.
PRINT THIS ARTICLE
DOUBLE BOTTOMS
Financials Select SPDR Double Bottom?
06/19/08 08:52:15 AMby Alan R. Northam
By casual observation, XLF looks like it is forming a double bottom, but don't be taken in. XLF has found some short-term support, but the main trend is still down, and here's why.
Position: N/A
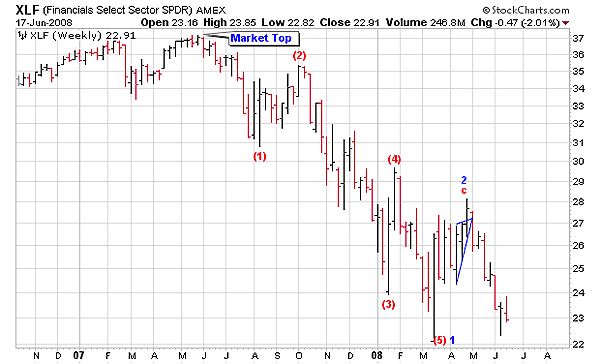
| Looking at Figure 1, we see that XLF made a major bull market top in mid-2007. Since then, XLF has been trading down and formed an impulse wave to the downside, which was completed in mid-March 2008. Impulse waves are made up of five waves: wave (1), (2), (3), (4), and (5), where the minimum price of wave (1) and the maximum price of wave (4) do not overlap. Wave (3) also cannot be the shortest wave, and in the case of XLF, it is actually the longest. Impulse waves define the direction of the major trend, which in the case of XLF is down. Upon the completion of the five-wave impulse wave, XLF started to trade in the upward direction. This upward move can take the form of either a three-wave corrective pattern or a five-wave impulse pattern. If the wave structure from mid-March to early May forms a three-wave corrective pattern, then that is an indication that the market is correcting for the move down from the bull market top. Once the correction is complete, the market will resume its downward trend. However, if the wave structure from mid-March to early May forms a five-wave impulse pattern, then that signals a trend change from down to up. To see the wave structure clearly, we must go to the daily time frame for XLF. |
|
| FIGURE 1: XLF, WEEKLY. Weekly bar chart of XLF showing Elliott wave count. This chart shows a five-wave impulse wave defining the market as being in a downward trend. |
| Graphic provided by: StockCharts.com. |
| |
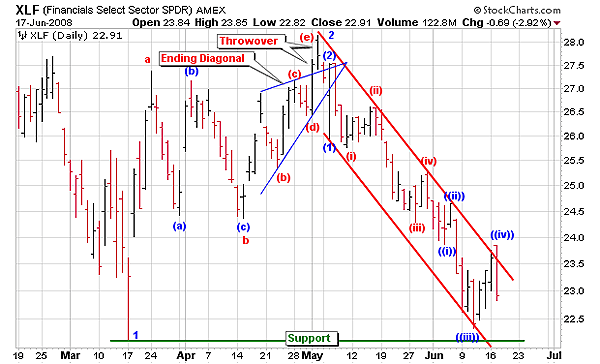
| In Figure 2 we see the daily bar chart for XLF. Note the wave structure from mid-March to early May, where it forms a classic three-wave corrective pattern made up of waves a, b, and c. Wave b is always made up of an a,b,c formation itself, and we can see this formation as waves (a), (b), and (c). Wave c sometimes forms and ends in a diagonal wave pattern, as wave c has done here. Wave c is made up of waves (a), (b), (c), (d), and (e), forming an ending diagonal wave pattern. Ending diagonal wave patterns also usually end with a "throwover," where the market will temporarily break out above the upper resistance line of the ending diagonal wave pattern before turning back down as it has done here. As you can see, the market correction from mid-March to early May has taken the shape of a classic corrective wave structure and not that of an impulse wave. This then signals that the move up from the mid-March low is nothing more than a market correction. Following market corrections, the market will resume its previous trend, which in the case of XLF is down. |
|
| FIGURE 2: XLF, DAILY. Daily bar chart of XLF showing the Elliott wave count. This chart shows that XLF had a market correction from mid-March to early May and has since resumed its downward trend. |
| Graphic provided by: StockCharts.com. |
| |
| From early May to the present, we can see that XLF has resumed its selloff and is in the process of forming another impulse wave to the downside. This impulse wave is expanding into subwaves, which is normally the case for waves 3. Recall that the impulse wave from the mid-2007 market top to the mid-March 2008 market low formed impulse wave 1. This impulse wave was then followed by corrective wave 2. With corrective wave 2 now complete, wave 3 down is now under way of a much larger impulse wave to be made up of waves 1, 2, 3, 4, and 5. This larger impulse wave still has wave 3 yet to be completed, a corrective wave 4, and a final wave 5 to go. Let's look at the subwave structure of wave 3. |
| Wave 3 is now expanding into subwaves to be made up of waves (1), (2), (3), (4), and (5). As you can see, waves (1) and (2) are now complete, with subwave (3) yet to be complete. Subwave (3) is also expanding into subwaves. Once all the subwaves of subwave (3) are complete, then subwave (3) will be complete. So as you can see, XLF still has a lot of work to do in the downward direction before completing waves 3, 4, and 5 of the much larger impulse wave being formed before this market can reverse its trend. |
| So don't get confused by casually looking at the recent wave structure of XLF. XLF is not forming a double-bottom reversal pattern. What appears to be forming may not be, but may be a different pattern in disguise. It is important to look below the surface of any double-bottom formation to learn its true identity. To be a true double-bottom reversal pattern, the two wave structures that have developed from the mid-March low to the present would have had to be reversed. The wave structure from the March low would have had to be an impulse wave instead of a corrective wave, and the move down from early May would have had to be a corrective wave pattern instead of a developing impulse wave. The impulse wave would have signaled a trend reversal and the corrective wave would have corrected the upward progress made by the impulse wave. Once the corrective wave was complete, we would have expected the market to turn back upward and move higher. However, this is not the case. The corrective wave structure from the mid-March low corrected the move down from the bull market top made in the middle of 2007. This corrective move is now complete and the market has since resumed its downward trend. Looking at the most recent action of XLF, note that subwave ((iii)) was completed when it found short-term support at the mid-March low (see green support line). XLF then bounced off support and has traded upward, running into resistance at the red downward sloping channel line. Looking at the final bar on the chart, we see that XLF has formed a key reversal pattern. This pattern now signals the completion of corrective subwave ((iv)) and the resumption of the downward trend. |
Alan Northam lives in the Dallas, Texas area and as an electronic engineer gave him an analytical mind from which he has developed a thorough knowledge of stock market technical analysis. His abilities to analyze the future direction of the stock market has allowed him to successfully trade of his own portfolio over the last 30 years. Mr. Northam is now retired and trading the stock market full time. You can reach him at inquiry@tradersclassroom.com or by visiting his website at http://www.tradersclassroom.com. You can also follow him on Twitter @TradersClassrm.
| Garland, Tx | |
| Website: | www.tradersclassroom.com |
| E-mail address: | inquiry@tradersclassroom.com |
Click here for more information about our publications!
Comments
Date:�06/19/08Rank:�4Comment:�

Request Information From Our Sponsors
- StockCharts.com, Inc.
- Candle Patterns
- Candlestick Charting Explained
- Intermarket Technical Analysis
- John Murphy on Chart Analysis
- John Murphy's Chart Pattern Recognition
- John Murphy's Market Message
- MurphyExplainsMarketAnalysis-Intermarket Analysis
- MurphyExplainsMarketAnalysis-Visual Analysis
- StockCharts.com
- Technical Analysis of the Financial Markets
- The Visual Investor
- VectorVest, Inc.
- Executive Premier Workshop
- One-Day Options Course
- OptionsPro
- Retirement Income Workshop
- Sure-Fire Trading Systems (VectorVest, Inc.)
- Trading as a Business Workshop
- VectorVest 7 EOD
- VectorVest 7 RealTime/IntraDay
- VectorVest AutoTester
- VectorVest Educational Services
- VectorVest OnLine
- VectorVest Options Analyzer
- VectorVest ProGraphics v6.0
- VectorVest ProTrader 7
- VectorVest RealTime Derby Tool
- VectorVest Simulator
- VectorVest Variator
- VectorVest Watchdog