HOT TOPICS LIST
- MACD
- Fibonacci
- RSI
- Gann
- ADXR
- Stochastics
- Volume
- Triangles
- Futures
- Cycles
- Volatility
- ZIGZAG
- MESA
- Retracement
- Aroon
INDICATORS LIST
LIST OF TOPICS
PRINT THIS ARTICLE
by Mike Carr, CMT
This well-known trading platform and brokerage firm is trading at a price equal to less than the cash on its books, and is a technical buy.
Position: Buy
Mike Carr, CMT
Mike Carr, CMT, is a member of the Market Technicians Association, and editor of the MTA's newsletter, Technically Speaking. He is also the author of "Smarter Investing in Any Economy: The Definitive Guide to Relative Strength Investing," and "Conquering the Divide: How to Use Economic Indicators to Catch Stock Market Trends."
PRINT THIS ARTICLE
STRATEGIES
TradeStation, A Potential Long Trade
06/17/08 08:37:09 AMby Mike Carr, CMT
This well-known trading platform and brokerage firm is trading at a price equal to less than the cash on its books, and is a technical buy.
Position: Buy
| TradeStation (TRAD) is known for its software that allows traders to perform unlimited backtesting in pursuit of profitable strategies. Its brokerage firm allows for low-cost executions, making it a favorite of active traders. Almost 40,000 customers use TradeStation, and the company reports the average account holder trades 730 times a year. Analysts following the company expect earnings per share to grow by more than 15% per year over the next five years. From a fundamental perspective, the stock sports a price/earnings ratio of 14 and has about $14 of cash per share on its books. At current levels, it's severely undervalued. |
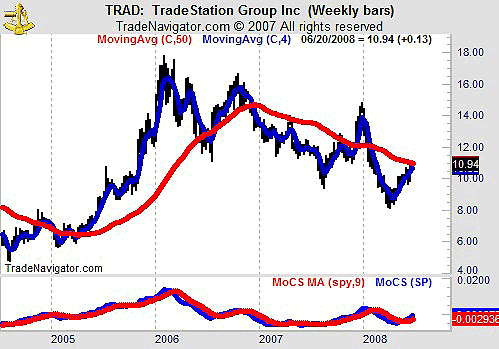
| The long-term chart (Figure 1) is showing signs of reversing a downtrend. Price is very close to the 50-week moving average. Relative strength, as measured by the momentum of comparative strength indicator, has just turned higher. This indicator displays relative strength in a manner similar to the more familiar moving average convergence/divergence (MACD), allowing for objective and a relatively simple interpretation of relative strength. |

|
| FIGURE 1: TRAD, WEEKLY. Relative strength is turning higher as price is challenging the long-term moving average. |
| Graphic provided by: Trade Navigator. |
| |
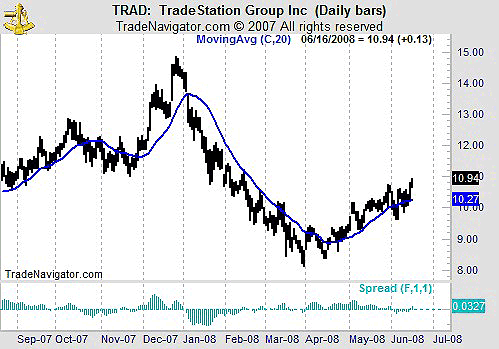
| The daily chart of TRAD (Figure 2) is bullish, indicating that now is a good time to buy shares. Prices crossed the 20-day moving average as they completed a rounding bottom. MACD also turned bullish. |

|
| FIGURE 2: TRAD, WEEKLY. This stock crossed above the 20-day moving average after a series of whipsaws. |
| Graphic provided by: Trade Navigator. |
| |
| Additional bullish support is found in the large short interest in TRAD. Buyins.net reports that shorts will need almost two weeks of normal trading volume to cover their positions in this stock. With more than 10% of the float shorted, there is a lot of potential demand. The squeeze trigger represents the average price level where short positions were initiated. At this level, many shorts are likely to cover their trade and find a more profitable opportunity in the market. Buyins.net calculates that the average short is now losing money since the squeeze trigger is 10.81. |
| TRAD represents a strong buy. The 20-day moving average can be used to set stops and limit initial losses. The measured move from the rounding bottom coincides with long-term resistance at 14, making this a trade with high potential reward for low risk. |
Mike Carr, CMT, is a member of the Market Technicians Association, and editor of the MTA's newsletter, Technically Speaking. He is also the author of "Smarter Investing in Any Economy: The Definitive Guide to Relative Strength Investing," and "Conquering the Divide: How to Use Economic Indicators to Catch Stock Market Trends."
| Website: | www.moneynews.com/blogs/MichaelCarr/id-73 |
| E-mail address: | marketstrategist@gmail.com |
Click here for more information about our publications!
Comments
Date: 06/25/08Rank: 4Comment:

Request Information From Our Sponsors
- StockCharts.com, Inc.
- Candle Patterns
- Candlestick Charting Explained
- Intermarket Technical Analysis
- John Murphy on Chart Analysis
- John Murphy's Chart Pattern Recognition
- John Murphy's Market Message
- MurphyExplainsMarketAnalysis-Intermarket Analysis
- MurphyExplainsMarketAnalysis-Visual Analysis
- StockCharts.com
- Technical Analysis of the Financial Markets
- The Visual Investor
- VectorVest, Inc.
- Executive Premier Workshop
- One-Day Options Course
- OptionsPro
- Retirement Income Workshop
- Sure-Fire Trading Systems (VectorVest, Inc.)
- Trading as a Business Workshop
- VectorVest 7 EOD
- VectorVest 7 RealTime/IntraDay
- VectorVest AutoTester
- VectorVest Educational Services
- VectorVest OnLine
- VectorVest Options Analyzer
- VectorVest ProGraphics v6.0
- VectorVest ProTrader 7
- VectorVest RealTime Derby Tool
- VectorVest Simulator
- VectorVest Variator
- VectorVest Watchdog
