HOT TOPICS LIST
- MACD
- Fibonacci
- RSI
- Gann
- ADXR
- Stochastics
- Volume
- Triangles
- Futures
- Cycles
- Volatility
- ZIGZAG
- MESA
- Retracement
- Aroon
INDICATORS LIST
LIST OF TOPICS
PRINT THIS ARTICLE
by James Kupfer
A convergence of technical indicators suggests that Forest Oil Corp. is ready to continue its trend up.
Position: Buy
James Kupfer
Mr. Kupfer is a market professional and amateur stock market commentator. Disclosure: It is likely that Mr. Kupfer has or will enter a position in any security he writes about.
PRINT THIS ARTICLE
LINEAR REG CHANNEL
Forest Oil Set To Move
06/18/08 08:57:41 AMby James Kupfer
A convergence of technical indicators suggests that Forest Oil Corp. is ready to continue its trend up.
Position: Buy
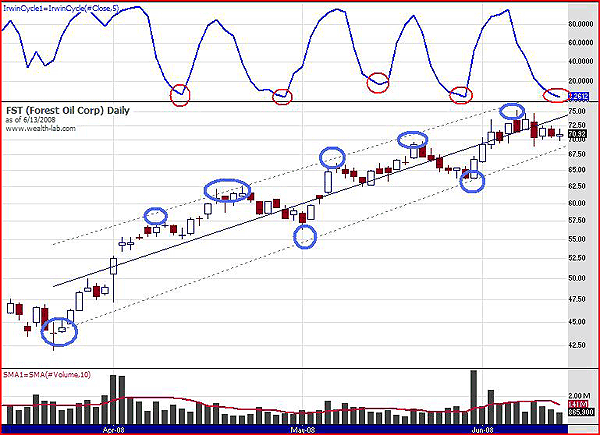
| Forest Oil Corp. (FST) has been in an overall uptrend since January 2007, and in an even more definitive uptrend since March 2008. The stock recently pulled back from its recent high in order to consolidate. At this point, there appears to be a convergence of technical indicators suggesting that FST is ready to continue its trend up. See Figure 1. |
| First, the stock is near the bottom up its upward sloping linear regression channel. Circled in blue, you can see that the stock has either touched or at least come close to the channel on eight different occasions. Second, circled in red are the troughs of the Irwin stochastic indicator, an indicator similar to the Bressert double smoothed stochastic. The previous four times it has fallen below 20 (oversold) corresponds to relative low points in the stock's price. The value currently stands at 3.26, indicating a dramatically oversold position. Finally, the recent period of price consolidation has occurred on declining volume. As opposed to price dropping on rising volume, this demonstrates a lack of selling conviction. See Figure 2. |

|
| FIGURE 1: FST, DAILY. A convergence of technical indicators suggests that FST is ready to continue its uptrend. |
| Graphic provided by: Wealth-Lab. |
| |
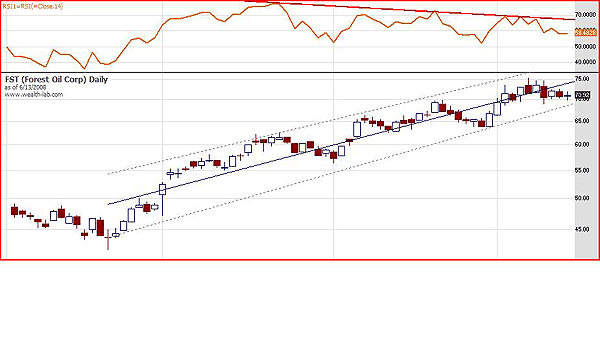
| These are the main indicators in my analysis that signal a potential bottom. However, there is one significant red flag that bears watching. The relative strength index (RSI) is divergent from the recent move up, with new highs in price not reflected in higher RSI readings. I have drawn a downward-sloping red line in the RSI pane to make the divergence clear. |

|
| FIGURE 2: FST, DAILY. A downsloping red line in the RSI suggests a divergence, however. |
| Graphic provided by: Wealth-Lab. |
| |
| Around the $70 level represents a moderate-risk entry point in this analysis. I have initiated a position at $70 with a stop below the June 10th low. Bearing in mind the RSI divergence, I will not be greedy, so if the price fails to break $75 soon I will exit the position. |
Mr. Kupfer is a market professional and amateur stock market commentator. Disclosure: It is likely that Mr. Kupfer has or will enter a position in any security he writes about.
Click here for more information about our publications!
PRINT THIS ARTICLE

Request Information From Our Sponsors
- StockCharts.com, Inc.
- Candle Patterns
- Candlestick Charting Explained
- Intermarket Technical Analysis
- John Murphy on Chart Analysis
- John Murphy's Chart Pattern Recognition
- John Murphy's Market Message
- MurphyExplainsMarketAnalysis-Intermarket Analysis
- MurphyExplainsMarketAnalysis-Visual Analysis
- StockCharts.com
- Technical Analysis of the Financial Markets
- The Visual Investor
- VectorVest, Inc.
- Executive Premier Workshop
- One-Day Options Course
- OptionsPro
- Retirement Income Workshop
- Sure-Fire Trading Systems (VectorVest, Inc.)
- Trading as a Business Workshop
- VectorVest 7 EOD
- VectorVest 7 RealTime/IntraDay
- VectorVest AutoTester
- VectorVest Educational Services
- VectorVest OnLine
- VectorVest Options Analyzer
- VectorVest ProGraphics v6.0
- VectorVest ProTrader 7
- VectorVest RealTime Derby Tool
- VectorVest Simulator
- VectorVest Variator
- VectorVest Watchdog
