HOT TOPICS LIST
- MACD
- Fibonacci
- RSI
- Gann
- ADXR
- Stochastics
- Volume
- Triangles
- Futures
- Cycles
- Volatility
- ZIGZAG
- MESA
- Retracement
- Aroon
INDICATORS LIST
LIST OF TOPICS
PRINT THIS ARTICLE
by Paolo Pezzutti
An increase in volatility could initiate a new directional move.
Position: N/A
Paolo Pezzutti
Author of the book "Trading the US Markets - A Comprehensive Guide to US Markets for International Traders and Investors" - Harriman House (July 2008)
PRINT THIS ARTICLE
BOLLINGER BANDS
Utilities Select Sector In Trading Range
06/17/08 09:57:19 AMby Paolo Pezzutti
An increase in volatility could initiate a new directional move.
Position: N/A
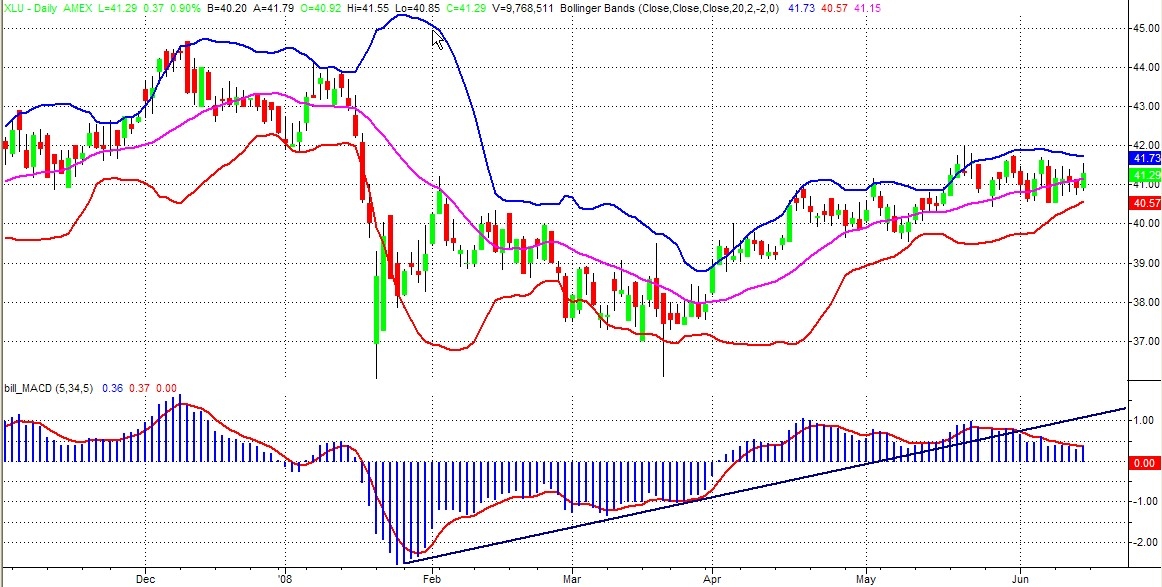
| The utilities sector has been quite resistant compared to other sectors during the recent move to the downside. After the January 2008 selloff that brought prices from a high at $44.66 in November 2007 to a low of $36.05, prices have managed to recover more than 50% of their losses. The Utilities Select Sector SPDR (XLU) retested the low in March and produced a positive divergence of many indicators, including the moving average convergence/divergence (MACD), as you can see in Figure 1, and then it started an up move during the past three months. This sector is quite interesting, although it cannot be completely immune from the conditions of the market, so much affected by the credit crisis combined with the unexpected exploding prices of energy and other commodities. Its recent behavior has characteristics that could provide a good trading opportunity. |

|
| FIGURE 1: XLU DAILY CHART. MACD printed a significant divergence when prices retested the low of January 2008. |
| Graphic provided by: TradeStation. |
| |
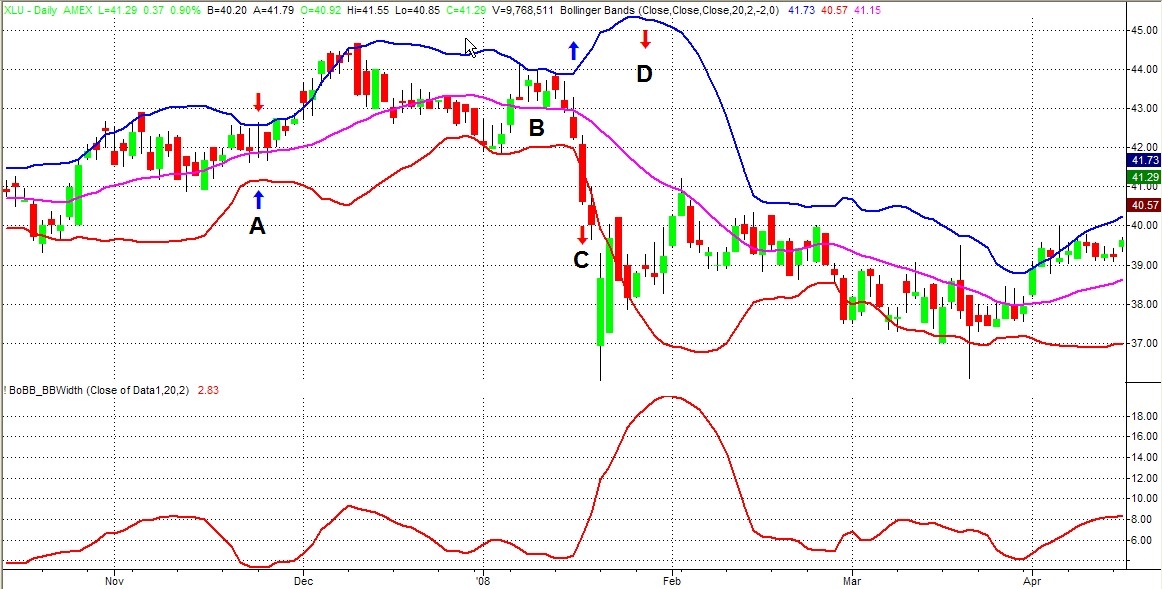
| Let's see how we can make use of the Bollinger bands to analyze the technical conditions of XLU. Bollinger bands consist of three curves. The trend is measured by the middle band, normally a simple 20-day moving average, which is the base for the upper and lower bands plotted two standard deviations off that. These parameters can be changed according to your preferences. Bollinger bands can be used on daily, weekly, and monthly charts, but also on an intraday basis for scalping trades. In Figure 2, you can see a daily chart of XLU and the Bollinger bands. From the width of the bands, you can get some good indications about the ongoing trend conditions. When the bands gets narrow, you can expect an expansion in volatility in the near future. Prices are in a trading range and the bands tend to converge. Most trends are born in trading ranges when the bands are parallel and flat. See points A and B in Figure 2. When the bands widen sharply, you can then spot the beginning of a directional trend (point C). At the end of a trend, the band on the other side of the trend will reverse. That leg of the move is over. |

|
| FIGURE 2: XLU DAILY CHART. Some examples of how Bollinger Bands can be used. |
| Graphic provided by: TradeStation. |
| |
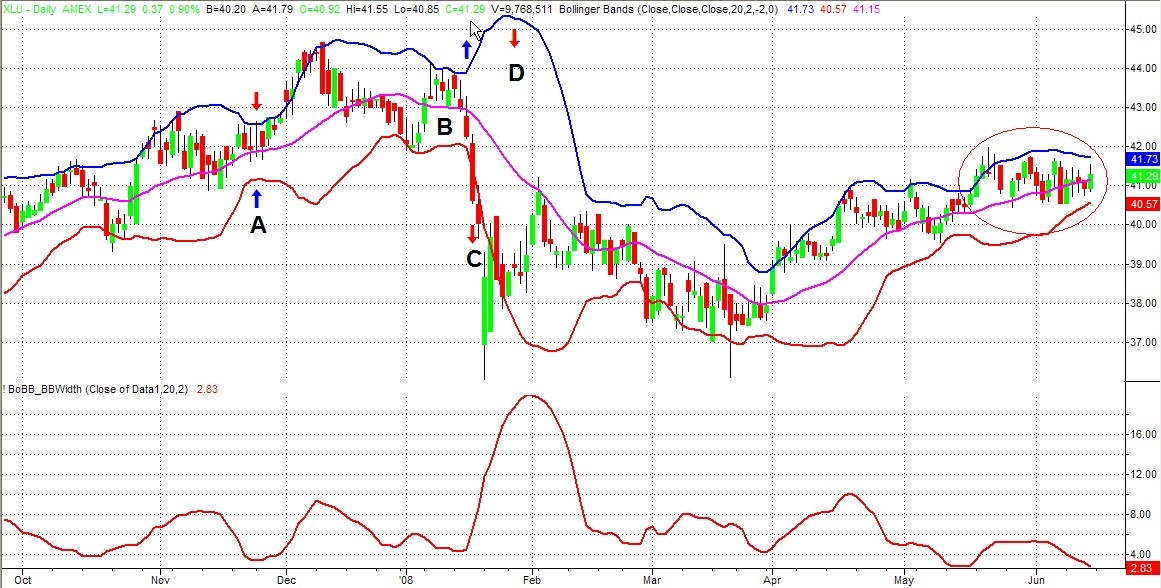
| From the Bollinger bands you can develop one indicator called BandWidth, which is a relative measure of the width of the bands. To calculate BandWidth, subtract the lower band from the upper one and normalize the result, divided by the middle band. The width of the bands is expressed as a percentage of the moving average. One way of using this indicator is to spot a powerful setup based on volatility. If volatility falls to extremely low levels, that situation is a forecast of a sudden increase in volatility and a new sustained trend. A breakout from the trading range is characterized by a sharp increase of BandWidth. In Figure 3, you can see that BandWidth is printing at very low levels. Prices are in a tight trading range and in a congestion during the last sessions. This would imply that XLU could be traded in a breakout mode. It is interesting to note that XLU developed a similar pattern from mid-April to mid-May. That trading range actually did not bring a new trend, but led to the development of the ongoing sideways move. |

|
| FIGURE 3: XLU DAILY CHART. Currently volatility is at very low levels, indicating that soon we could see a new trend emerge. |
| Graphic provided by: TradeStation. |
| |
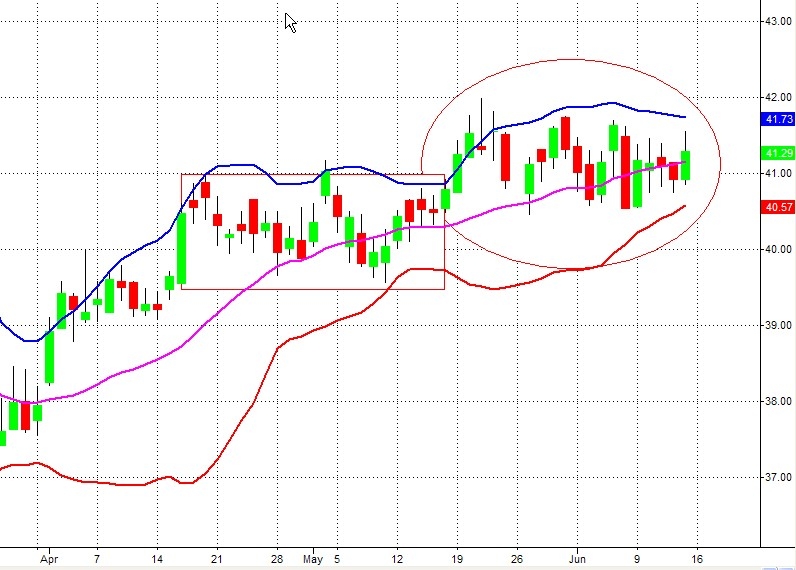
| The fact that XLU entered a congestion when most sectors entered a negative phase is quite interesting and indicates that investors look at this sector as a relatively safe, low-volatility environment. I would expect to see prices break out to the upside, continuing the up move. I would see the trading range as a pause in the ongoing move, not as a reversal pattern. It is difficult to predict the direction of the breakout and breakouts can also fail. There are two options if you intend to open a position. Either you wait for the breakout, reducing potential profit but having indications about the direction of the future trend. Or you take a risk, anticipating the direction of the breakout. It is up to you and your trading style. The first resistance is at $42 with an objective at $44-44.50 to retest previous highs. Support is in the $40.50 area. See Figure 4. |

|
| FIGURE 4: XLU DAILY CHART. Also from mid April to mid May a trading range was developed. Prices moved up only to form another low volatility formation. |
| Graphic provided by: TradeStation. |
| |
Author of the book "Trading the US Markets - A Comprehensive Guide to US Markets for International Traders and Investors" - Harriman House (July 2008)
| Address: | VIA ROBERTO AGO 26 POSTAL CODE 00166 |
| Rome, ITALY | |
| Phone # for sales: | +393357540708 |
| E-mail address: | pezzutti.paolo@tiscali.it |
Click here for more information about our publications!
Comments

Request Information From Our Sponsors
- StockCharts.com, Inc.
- Candle Patterns
- Candlestick Charting Explained
- Intermarket Technical Analysis
- John Murphy on Chart Analysis
- John Murphy's Chart Pattern Recognition
- John Murphy's Market Message
- MurphyExplainsMarketAnalysis-Intermarket Analysis
- MurphyExplainsMarketAnalysis-Visual Analysis
- StockCharts.com
- Technical Analysis of the Financial Markets
- The Visual Investor
- VectorVest, Inc.
- Executive Premier Workshop
- One-Day Options Course
- OptionsPro
- Retirement Income Workshop
- Sure-Fire Trading Systems (VectorVest, Inc.)
- Trading as a Business Workshop
- VectorVest 7 EOD
- VectorVest 7 RealTime/IntraDay
- VectorVest AutoTester
- VectorVest Educational Services
- VectorVest OnLine
- VectorVest Options Analyzer
- VectorVest ProGraphics v6.0
- VectorVest ProTrader 7
- VectorVest RealTime Derby Tool
- VectorVest Simulator
- VectorVest Variator
- VectorVest Watchdog
