HOT TOPICS LIST
- MACD
- Fibonacci
- RSI
- Gann
- ADXR
- Stochastics
- Volume
- Triangles
- Futures
- Cycles
- Volatility
- ZIGZAG
- MESA
- Retracement
- Aroon
INDICATORS LIST
LIST OF TOPICS
PRINT THIS ARTICLE
by Koos van der Merwe
Is a buy signal given by Citigroup the start of a recovery for financial institutions?
Position: Buy
Koos van der Merwe
Has been a technical analyst since 1969, and has worked as a futures and options trader with First Financial Futures in Johannesburg, South Africa.
PRINT THIS ARTICLE
DOUBLE BOTTOMS
Citigroup — The Beginning Of The Beginning?
06/17/08 08:13:37 AMby Koos van der Merwe
Is a buy signal given by Citigroup the start of a recovery for financial institutions?
Position: Buy
| The subprime crisis was the result of financial institutions exceeding their responsibility by chasing profits and ignoring the potential risks created. Today, we all know the consequences of that greed: the subprime crisis and the United States flirting with recession. "The worst is over for the credit crisis, or will be soon, and there is now a reduced possibility of a deep recession," said former Federal Reserve chairman Alan Greenspan on June 13. He was possibly looking at the chart of Citigroup (Figure 1). |
| Citigroup was one of the worst-hit banks by the credit crisis, causing the ousting of Charles Prince, its chief executive, on November 4, 2007. Figure 1 suggests that the end may be in sight. |
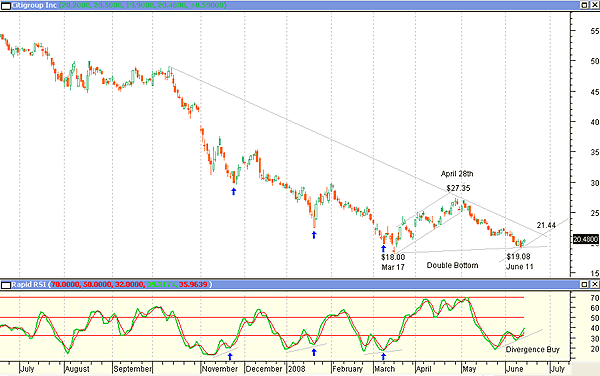
| Figure 1 shows how the stock price fell after having reached a high in December 2006 of $57. On March 17, it hit a low of $18. The stock price started to recover, reaching a high of $27.35 on April 28, before falling back to a low of $19.08 on June 11 and forming what I believe is a double bottom. At this price, the indicator I have chosen as my preferred indicator, the rapid relative strength index (RSI), gave a divergence buy signal. Looking back at previous divergent signals given, we can see that they were all successful. |

|
| FIGURE 1: CITIGROUP, DAILY. This chart shows the double bottom that has formed. |
| Graphic provided by: MetaStock. |
| |
| Does this mean that we should take the plunge and buy Citigroup stock? My answer is yes. With the rapid RSI giving a buy signal and with a double bottom definitely in place, we could buy the stock and hold. The more conservative investor could wait for the stock price to break above the trendline at $21.44. I do not believe that there will be fireworks, looking rather for a long-term recovery than a short-term flip. My suggested target is $35.62 (27.35 - 19.08 = 8.27 + 27.35 = 35.62). The credit crisis appears to be bottoming as suggested by Alan Greenspan. It could be time to selectively buy financial stocks, for a long-term hold. |
Has been a technical analyst since 1969, and has worked as a futures and options trader with First Financial Futures in Johannesburg, South Africa.
| Address: | 3256 West 24th Ave |
| Vancouver, BC | |
| Phone # for sales: | 6042634214 |
| E-mail address: | petroosp@gmail.com |
Click here for more information about our publications!
Comments
Date: 06/28/08Rank: 1Comment:

Request Information From Our Sponsors
- StockCharts.com, Inc.
- Candle Patterns
- Candlestick Charting Explained
- Intermarket Technical Analysis
- John Murphy on Chart Analysis
- John Murphy's Chart Pattern Recognition
- John Murphy's Market Message
- MurphyExplainsMarketAnalysis-Intermarket Analysis
- MurphyExplainsMarketAnalysis-Visual Analysis
- StockCharts.com
- Technical Analysis of the Financial Markets
- The Visual Investor
- VectorVest, Inc.
- Executive Premier Workshop
- One-Day Options Course
- OptionsPro
- Retirement Income Workshop
- Sure-Fire Trading Systems (VectorVest, Inc.)
- Trading as a Business Workshop
- VectorVest 7 EOD
- VectorVest 7 RealTime/IntraDay
- VectorVest AutoTester
- VectorVest Educational Services
- VectorVest OnLine
- VectorVest Options Analyzer
- VectorVest ProGraphics v6.0
- VectorVest ProTrader 7
- VectorVest RealTime Derby Tool
- VectorVest Simulator
- VectorVest Variator
- VectorVest Watchdog
