HOT TOPICS LIST
- MACD
- Fibonacci
- RSI
- Gann
- ADXR
- Stochastics
- Volume
- Triangles
- Futures
- Cycles
- Volatility
- ZIGZAG
- MESA
- Retracement
- Aroon
INDICATORS LIST
LIST OF TOPICS
PRINT THIS ARTICLE
by Mike Carr, CMT
Relative strength offers traders a way to identify top-performing sectors, and exchange traded funds offer a way for investors to trade these ideas.
Position: Buy
Mike Carr, CMT
Mike Carr, CMT, is a member of the Market Technicians Association, and editor of the MTA's newsletter, Technically Speaking. He is also the author of "Smarter Investing in Any Economy: The Definitive Guide to Relative Strength Investing," and "Conquering the Divide: How to Use Economic Indicators to Catch Stock Market Trends."
PRINT THIS ARTICLE
REL. STR COMPARATIVE
Using Sector Strength To Identify Buys
06/13/08 09:21:45 AMby Mike Carr, CMT
Relative strength offers traders a way to identify top-performing sectors, and exchange traded funds offer a way for investors to trade these ideas.
Position: Buy
| A useful exercise for all traders is to scan a list of the strongest sectors at least once a week. This provides a great starting point for daytrading, since the strongest sector will include the strongest stocks. Relative strength (RS) usually identifies the largest gainers over the recent past, and these are also usually the most volatile stocks. Volatility is a requirement for short-term trading since the goal is to maximize gains in the shortest possible time. |
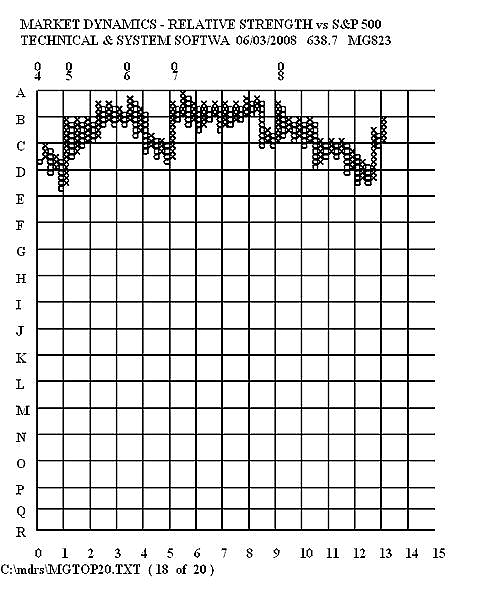
| Among the groups leading the market in RS is the software group (Figure 1). The point & figure chart of RS allows us to easily observe the larger trend without being distracted by the day-to-day market noise. We can see that the software group has been basing for a few years and has just completed a clear buy signal. |

|
| FIGURE 1: RELATIVE STRENGTH. On a point & figure chart, we can see that the RS of the software sector has just broken a small downtrend and is on a buy signal. |
| Graphic provided by: Market Dynamics. |
| |
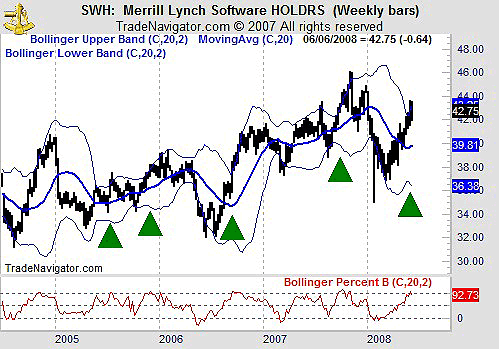
| With this insight into the longer-term trend, we identify a trading candidate. In this case, Merrill Lynch Software HOLDRS (SWH) is an ETF representative of the sector index shown in Figure 1. The next step is to look at a weekly chart of SWH (Figure 2). There we see that prices have just closed above their upper Bollinger band. We look back on the chart to see that this has happened before. In those instances, buying with a stop at the 20-week moving average would have led to two winning trades and two losers. |

|
| FIGURE 2: SWH, WEEKLY. Price is moving sharply higher. |
| Graphic provided by: Trade Navigator. |
| |
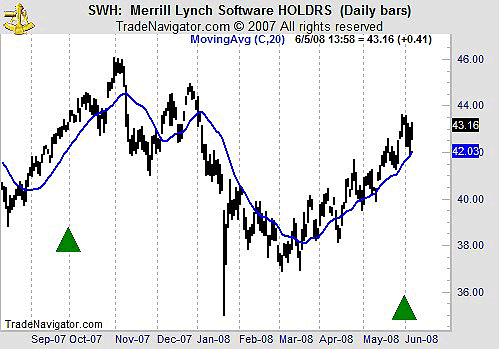
| Using the daily chart in Figure 3, we can fine-tune our trading strategy. The chart shows a rounding-bottom pattern nearing completion. Aggressive traders can enter the trade at current levels, and conservative traders can await the completion of the pattern, entering on a buy-stop at 44.50 or 45. |

|
| FIGURE 3: SWH, DAILY. The daily chart of SWH can be used to time the trade entry and stop-loss points. |
| Graphic provided by: Trade Navigator. |
| |
| The 20-day moving average has provided a good indicator of the trend. To avoid a whipsaw, a 5% band would be effective. This places the current stop level at 39.85, meaning a trader would have a risk of about 10% on this position. |
Mike Carr, CMT, is a member of the Market Technicians Association, and editor of the MTA's newsletter, Technically Speaking. He is also the author of "Smarter Investing in Any Economy: The Definitive Guide to Relative Strength Investing," and "Conquering the Divide: How to Use Economic Indicators to Catch Stock Market Trends."
| Website: | www.moneynews.com/blogs/MichaelCarr/id-73 |
| E-mail address: | marketstrategist@gmail.com |
Click here for more information about our publications!
Comments
Date: 06/17/08Rank: 5Comment:

Request Information From Our Sponsors
- StockCharts.com, Inc.
- Candle Patterns
- Candlestick Charting Explained
- Intermarket Technical Analysis
- John Murphy on Chart Analysis
- John Murphy's Chart Pattern Recognition
- John Murphy's Market Message
- MurphyExplainsMarketAnalysis-Intermarket Analysis
- MurphyExplainsMarketAnalysis-Visual Analysis
- StockCharts.com
- Technical Analysis of the Financial Markets
- The Visual Investor
- VectorVest, Inc.
- Executive Premier Workshop
- One-Day Options Course
- OptionsPro
- Retirement Income Workshop
- Sure-Fire Trading Systems (VectorVest, Inc.)
- Trading as a Business Workshop
- VectorVest 7 EOD
- VectorVest 7 RealTime/IntraDay
- VectorVest AutoTester
- VectorVest Educational Services
- VectorVest OnLine
- VectorVest Options Analyzer
- VectorVest ProGraphics v6.0
- VectorVest ProTrader 7
- VectorVest RealTime Derby Tool
- VectorVest Simulator
- VectorVest Variator
- VectorVest Watchdog
